LOFAR Unified Calculator for Imaging (LUCI) 1
The LOFAR Unified Calculator for Imaging, or LUCI, is a unified web interface that allows users to compute several parameters relevant for planning an interferometric observation with LOFAR. The web interface can be accessed at https://support.astron.nl/luci. A similar tool for planning beamformed observations is under development.
LUCI is developed and maintained by the SDC Operations group (SDCO) at ASTRON. The source code is publicly available on GitHub at https://github.com/scisup/LOFAR-calculator. For comments and/or feature requests, please contact the SDCO group using the JIRA Helpdesk.
For a given observation and pipeline setup, the web interface allows users to
compute the raw and processed data size,
compute theoretical image sensitivity,
estimate the pipeline processing time,
plot the elevation of the sources to observe on any given date,
plan multi-beam observations, and
export the observation and pipeline setup in a PDF format.
The landing page of the LUCI web interface is shown below in Fig. 38. The page is divided into three columns each allowing the user to set a specific aspect of the observation. By setting different input fields, users can compute some or all of the parameters listed above. The different functionalities of LUCI are explained below.
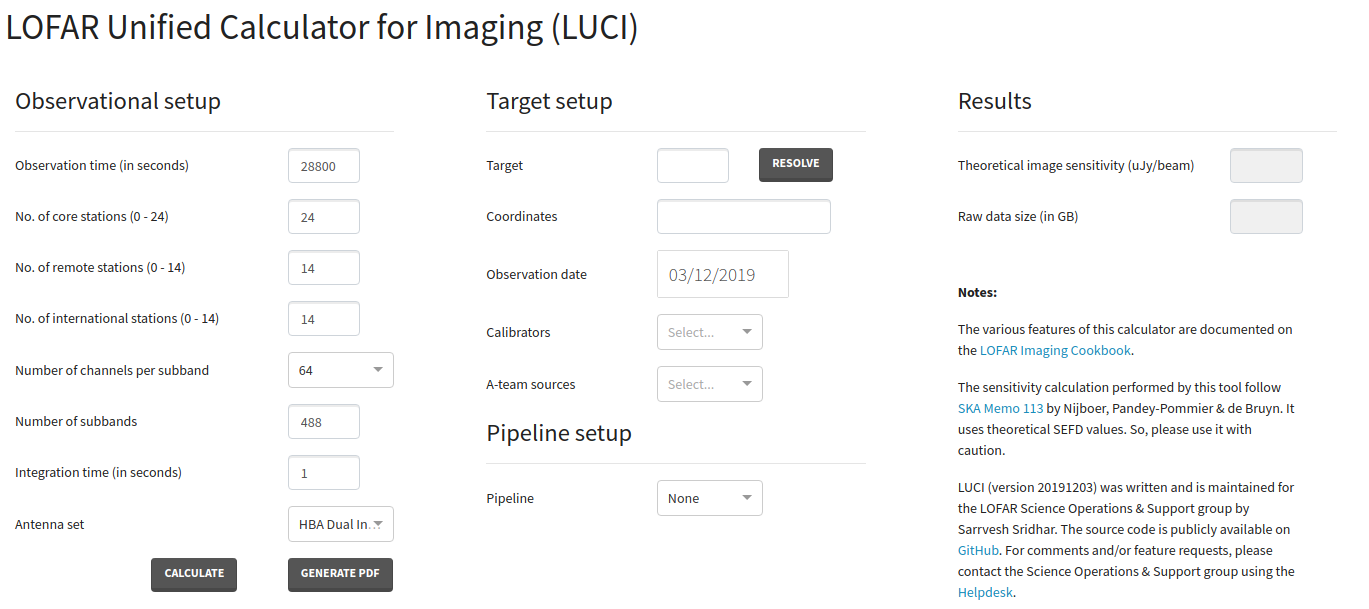
Fig. 38 The web interface to the LOFAR Unified Calculator for Imaging (LUCI).
Setting up an observation
The Observational setup section in LUCI allows users to specify an interferometric observing run with LOFAR. The various fields under this section are:
Observation time (in seconds) – Duration of an observing run (default: 28800 seconds). LUCI throws an error if a negative value is provided as input.
No. of core stations (0 - 24) (default: 24)
No. of remote stations (0 - 14) (default: 14)
No. of international stations (0 - 14) (default: 14)
Number of channels per subband – Frequency resolution of an observing run. Allowed values are 64, 128, and 256 channels per subband (default: 64)
Number of subbands – Number of subbands to record as part of the observing run (default: 488). LUCI thows an error if the number of subbands is greater than 488.
Integration time (in seconds) - Correlator integration time. This input field determines the time resolution of the observing run (default: 1 second). LUCI thows an error if correlator time is smaller than 0.16 seconds.
Antenna set – specifies the mode in which the stations are operated. Allowed values are LBA Outer, HBA Dual, and HBA Dual Inner. (default: HBA Dual Inner).
Upon clicking the button Calculate, LUCI computes the theoretical image sensitivity and the raw data size. The results of this computation is displayed to the user under the Results section. Note that before doing the calculations, LUCI validates the input specified by the user. If an invalid input is detected, LUCI displays an error as shown in Fig. 39.
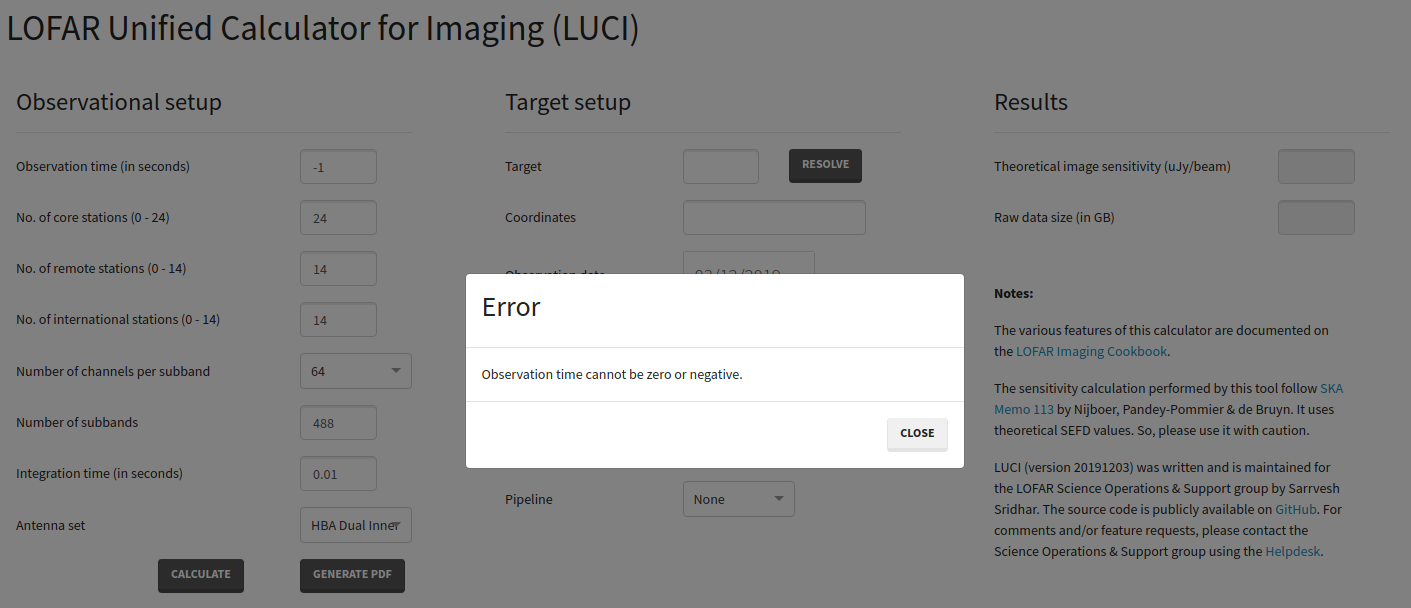
Fig. 39 Example error message displayed to the user. Before performing the calculations, LUCI validates the user input. If an invalid input is detected, LUCI shows a similar error message.
Setting up a preprocessing pipeline
Pipelines can be setup in LUCI using the field Pipeline dropdown button under Pipeline setup. At the moment, only a preprocessing pipeline can be specified. By default, no pipeline is attached to the observing run and hence the field Pipeline is set to None. To attach a preprocessing pipeline, set the Pipeline field to Preprocessing. Toggling the Pipeline field reveals a few more input fields (see Fig. 40) under Pipeline setup which can be used to tweak the behaviour of the pipeline. The new, pipeline-specific fields are
Time averaging factor How much averaging to perform along the time axis (default: 1),
Frequency averaging factor How much averaging to perform along the freqency axis (default: 1), and
Enable dysco compression? Should the output measurement sets produced by the preprocessing pipeline be compressed with Dysco? (default: Enabled).
Upon clicking the Calculate button, LUCI calculates Processed data size and Pipeline processing time in addition to Theoretical image sensitivity and Raw data size mentioned earlier.
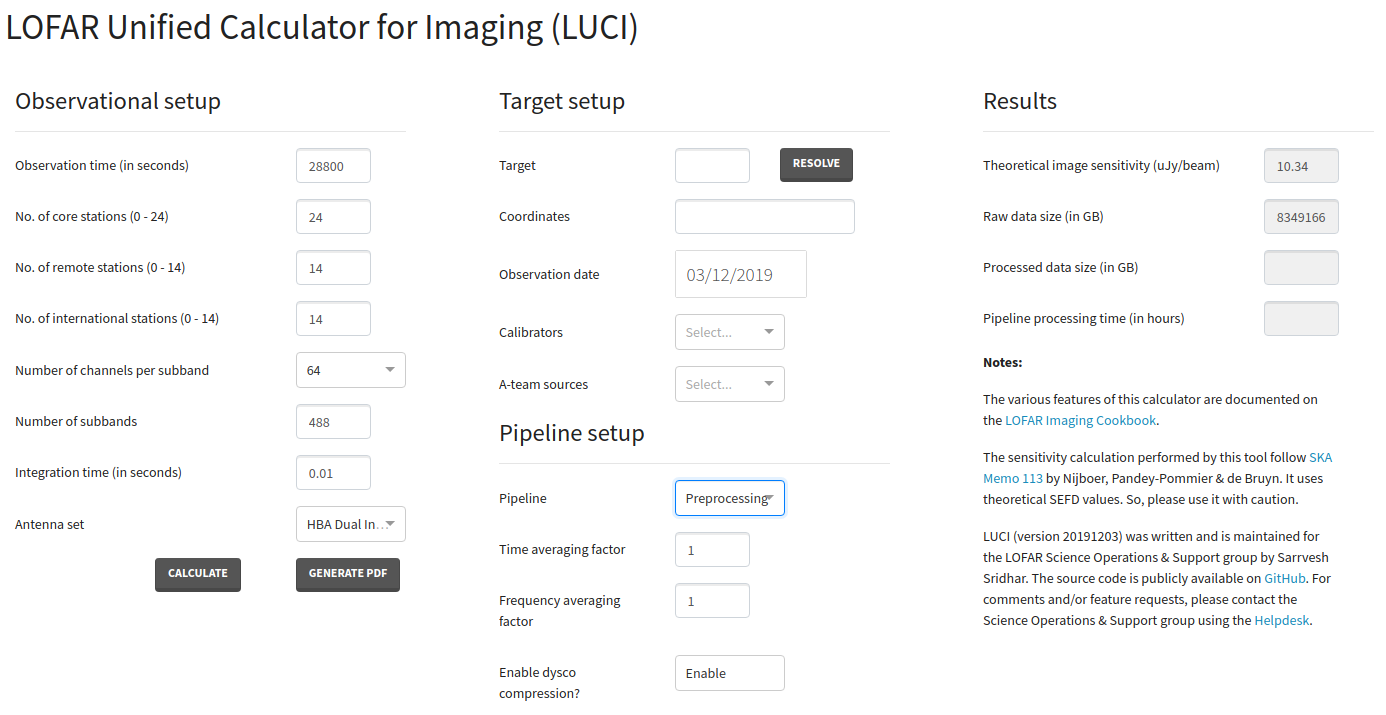
Fig. 40 LUCI web interface showing the pipeline fields that are revealed when the field Pipeline is set to Preprocessing.
Specifying targets, calibrators, and A-team sources
Besides calculating the data sizes and processing times, LUCI also allows users to check if their target of interest is visible to LOFAR on a specific date. The target of interest can be specified in the Target field under the Target setup section. If the specified source is valid, the Resolve button can be used to obtain the coordinates of that source. Note that LUCI can resolve valid LoTSS pointing names as well (like P17 or P205+67). If however, the user wishes to manually input the coordinates, a target name must also be specified. The Observation date field allows the user to specify a date on which the target elevation needs to be calculated.
In addition to plotting the target, users can also plot the elevations of standard LOFAR calibrators and A-team sources by selecting them using the Calibrators and the A-team sources dropdown boxes.
Upon clicking the Calculate button, LUCI produces three plots like the once shown below:
Target visibility plot shows the elevation of a target as seen by LOFAR on the specified date as an interactive plot. If the field No. of international stations (0-14) is set to 0 (i.e.) observing with only the Dutch array, the target elevation is calculated with respect to the LOFAR core. On the other hand, if the user specifies the full array, LUCI plots the minimum apparent elevation of the target as seen by all LOFAR stations. In addition to the user-specified target, LUCI also plots the elevations of the Sun, the Moon, and Jupiter by default. The two blue regions indicate the sunrise and sunset times.
Beam Layout plots the tile and station beams for the specified observation.
Angular distance between specified target and other bright sources table.
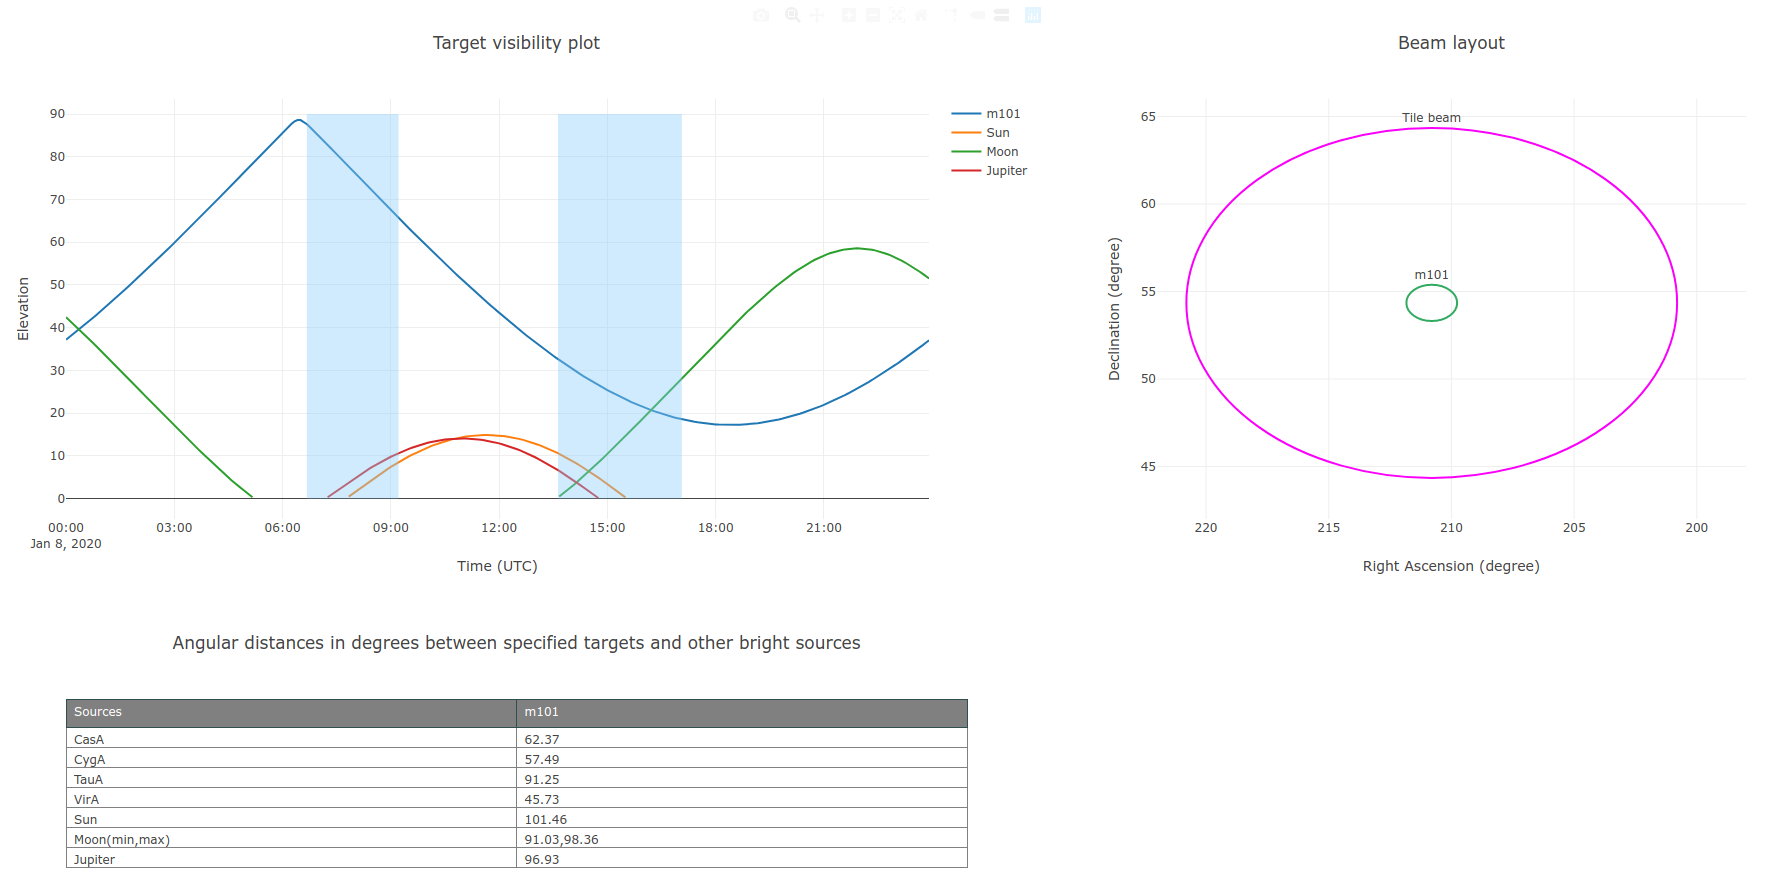
Fig. 41 LUCI web interface showing the target visibility and beam layout plots along with a table showing the angular distance between the specified target and known bright radio sources. Note that the target visibility plot shows the elevation of the Sun, the Moon and Jupiter in addition to the user-specified target. Also note that both the target visibility and beam layout plots are interactive plots.
Setting up multi-beam observations
To observe multiple sources with LOFAR simultaeously making use of its multi-beam capability, the user can specify multiple sources in the Target field as a comma-separated value. LUCI can handle coordinate resolution of both single and multiple sources. While specifying multiple sources, LUCI will throw an error if
the number of sources mentioned in the Target field does not match the number of coordinates,
the number of sources times the number of subbands is greater than 488. This is because any LOFAR observation cannot have more than 488 subbands.
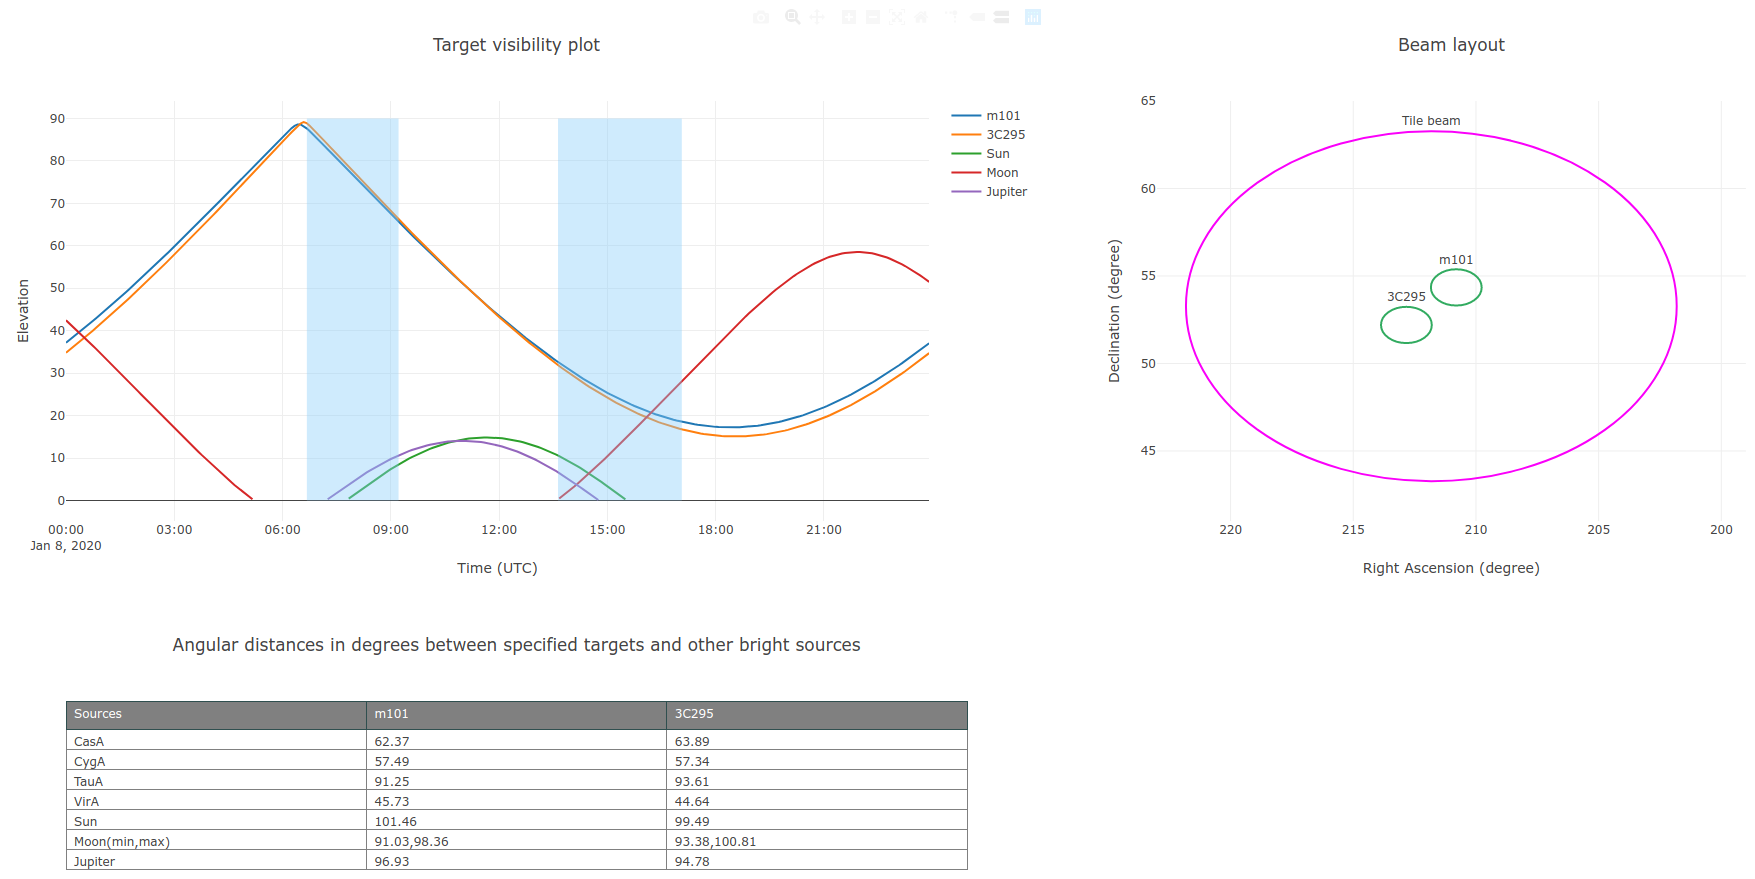
Fig. 42 LUCI web interface showing the target visibility and beam layout plots along with a table showing the angular distance between the specified targets and known bright radio sources.
Exporting the setup
Users can export their “observational setup” to a PDF file using the Generate PDF button. Upon clicking the Generate PDF button, LUCI exposes the Download file link (see Fig. 43) below the two buttons which can be used to download the generated PDF file.
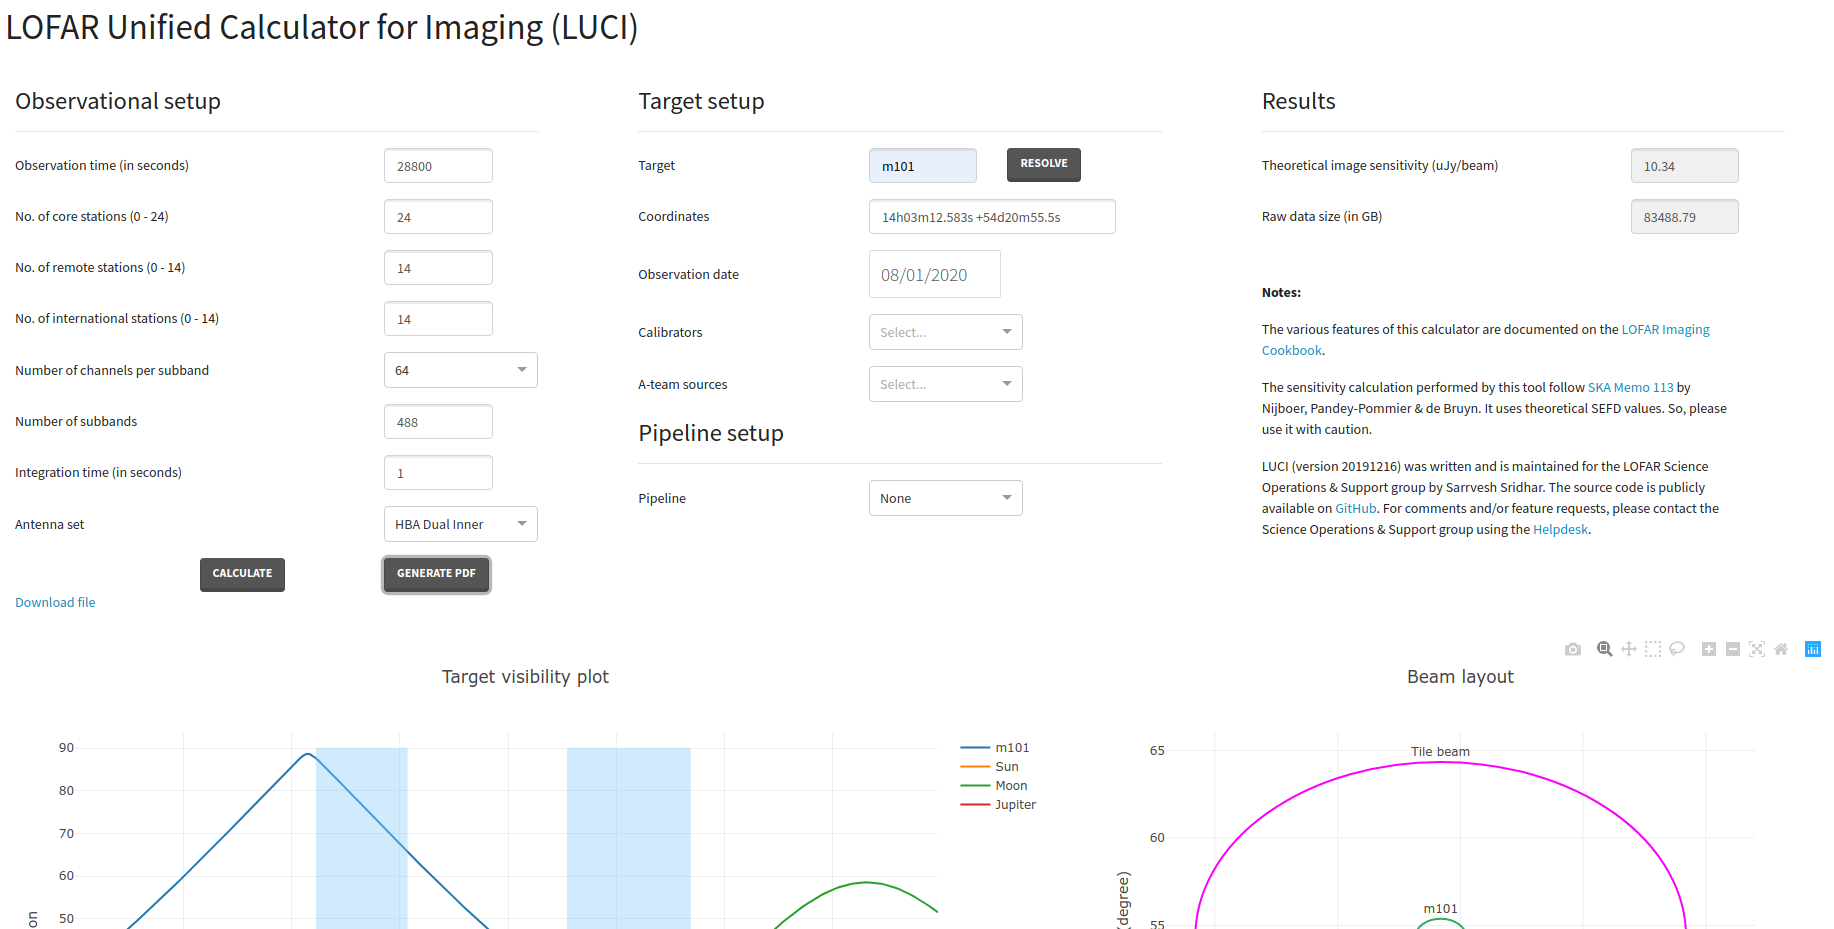
Fig. 43 LUCI web interface showing the PDF download link after a user clicks on the Generate PDF button.
Note that if you click on the Generate PDF button before using the Calculate button, LUCI will throw an error.
Frequently Asked Questions (FAQ)
In what framework is LUCI implemented?
Can I contribute to LUCI?
Sure! The source code of LUCI is available on GitHub. If you have an interesting feature, feel free to submit a pull request to this repository.
Footnotes
- 1
This chapter was written by Sarrvesh Sridhar <mailto:sarrvesh@astron.nl> and is manitained by Sander ter Veen.