This page summarizes various tests done with demixing (mainly LBA some HBA) LOFAR data, as a precursor to LOFAR 2.0 data.
The demixing has a slightly improved solver, which can be turned on by using the parset keys:
demix.lbfgs.solution.range=[-10000,10000]
This will limit the solution range to the lower and upper limits as speficied above (-10000 and 10000 in the example). If this is not defined, the old solver is used.
HBA
A single subband of L620546, 64chan, 2min data sample was used for the test. The time to demix 4 sources (CasA, CygA, TauA, VirA) with old demixing:
Total DP3 time 266.75 real 1133.4 user 8.01 system
0.3% ( 931 ms) MSReader
99.3% ( 264 s) Demixer demix.
0.9% ( 2272 ms) of it spent in phase shifting/averaging data
7.9% ( 20 s) of it spent in calculating decorrelation factors
88.8% ( 235 s) of it spent in estimating gains and computing residuals
2.1% ( 5576 ms) of it spent in writing gain solutions to disk
0.3% ( 745 ms) MSWriter msout.
66.3% ( 494 ms) Creating task
80.8% ( 602 ms) Writing (threaded)
Time with new demixing:
Total DP3 time 119.43 real 499.68 user 6.34 system
0.8% ( 1000 ms) MSReader
98.5% ( 117 s) Demixer demix.
1.8% ( 2166 ms) of it spent in phase shifting/averaging data
17.4% ( 20 s) of it spent in calculating decorrelation factors
75.2% ( 88 s) of it spent in estimating gains and computing residuals
4.7% ( 5559 ms) of it spent in writing gain solutions to disk
0.6% ( 673 ms) MSWriter msout.
64.0% ( 431 ms) Creating task
79.2% ( 533 ms) Writing (threaded)
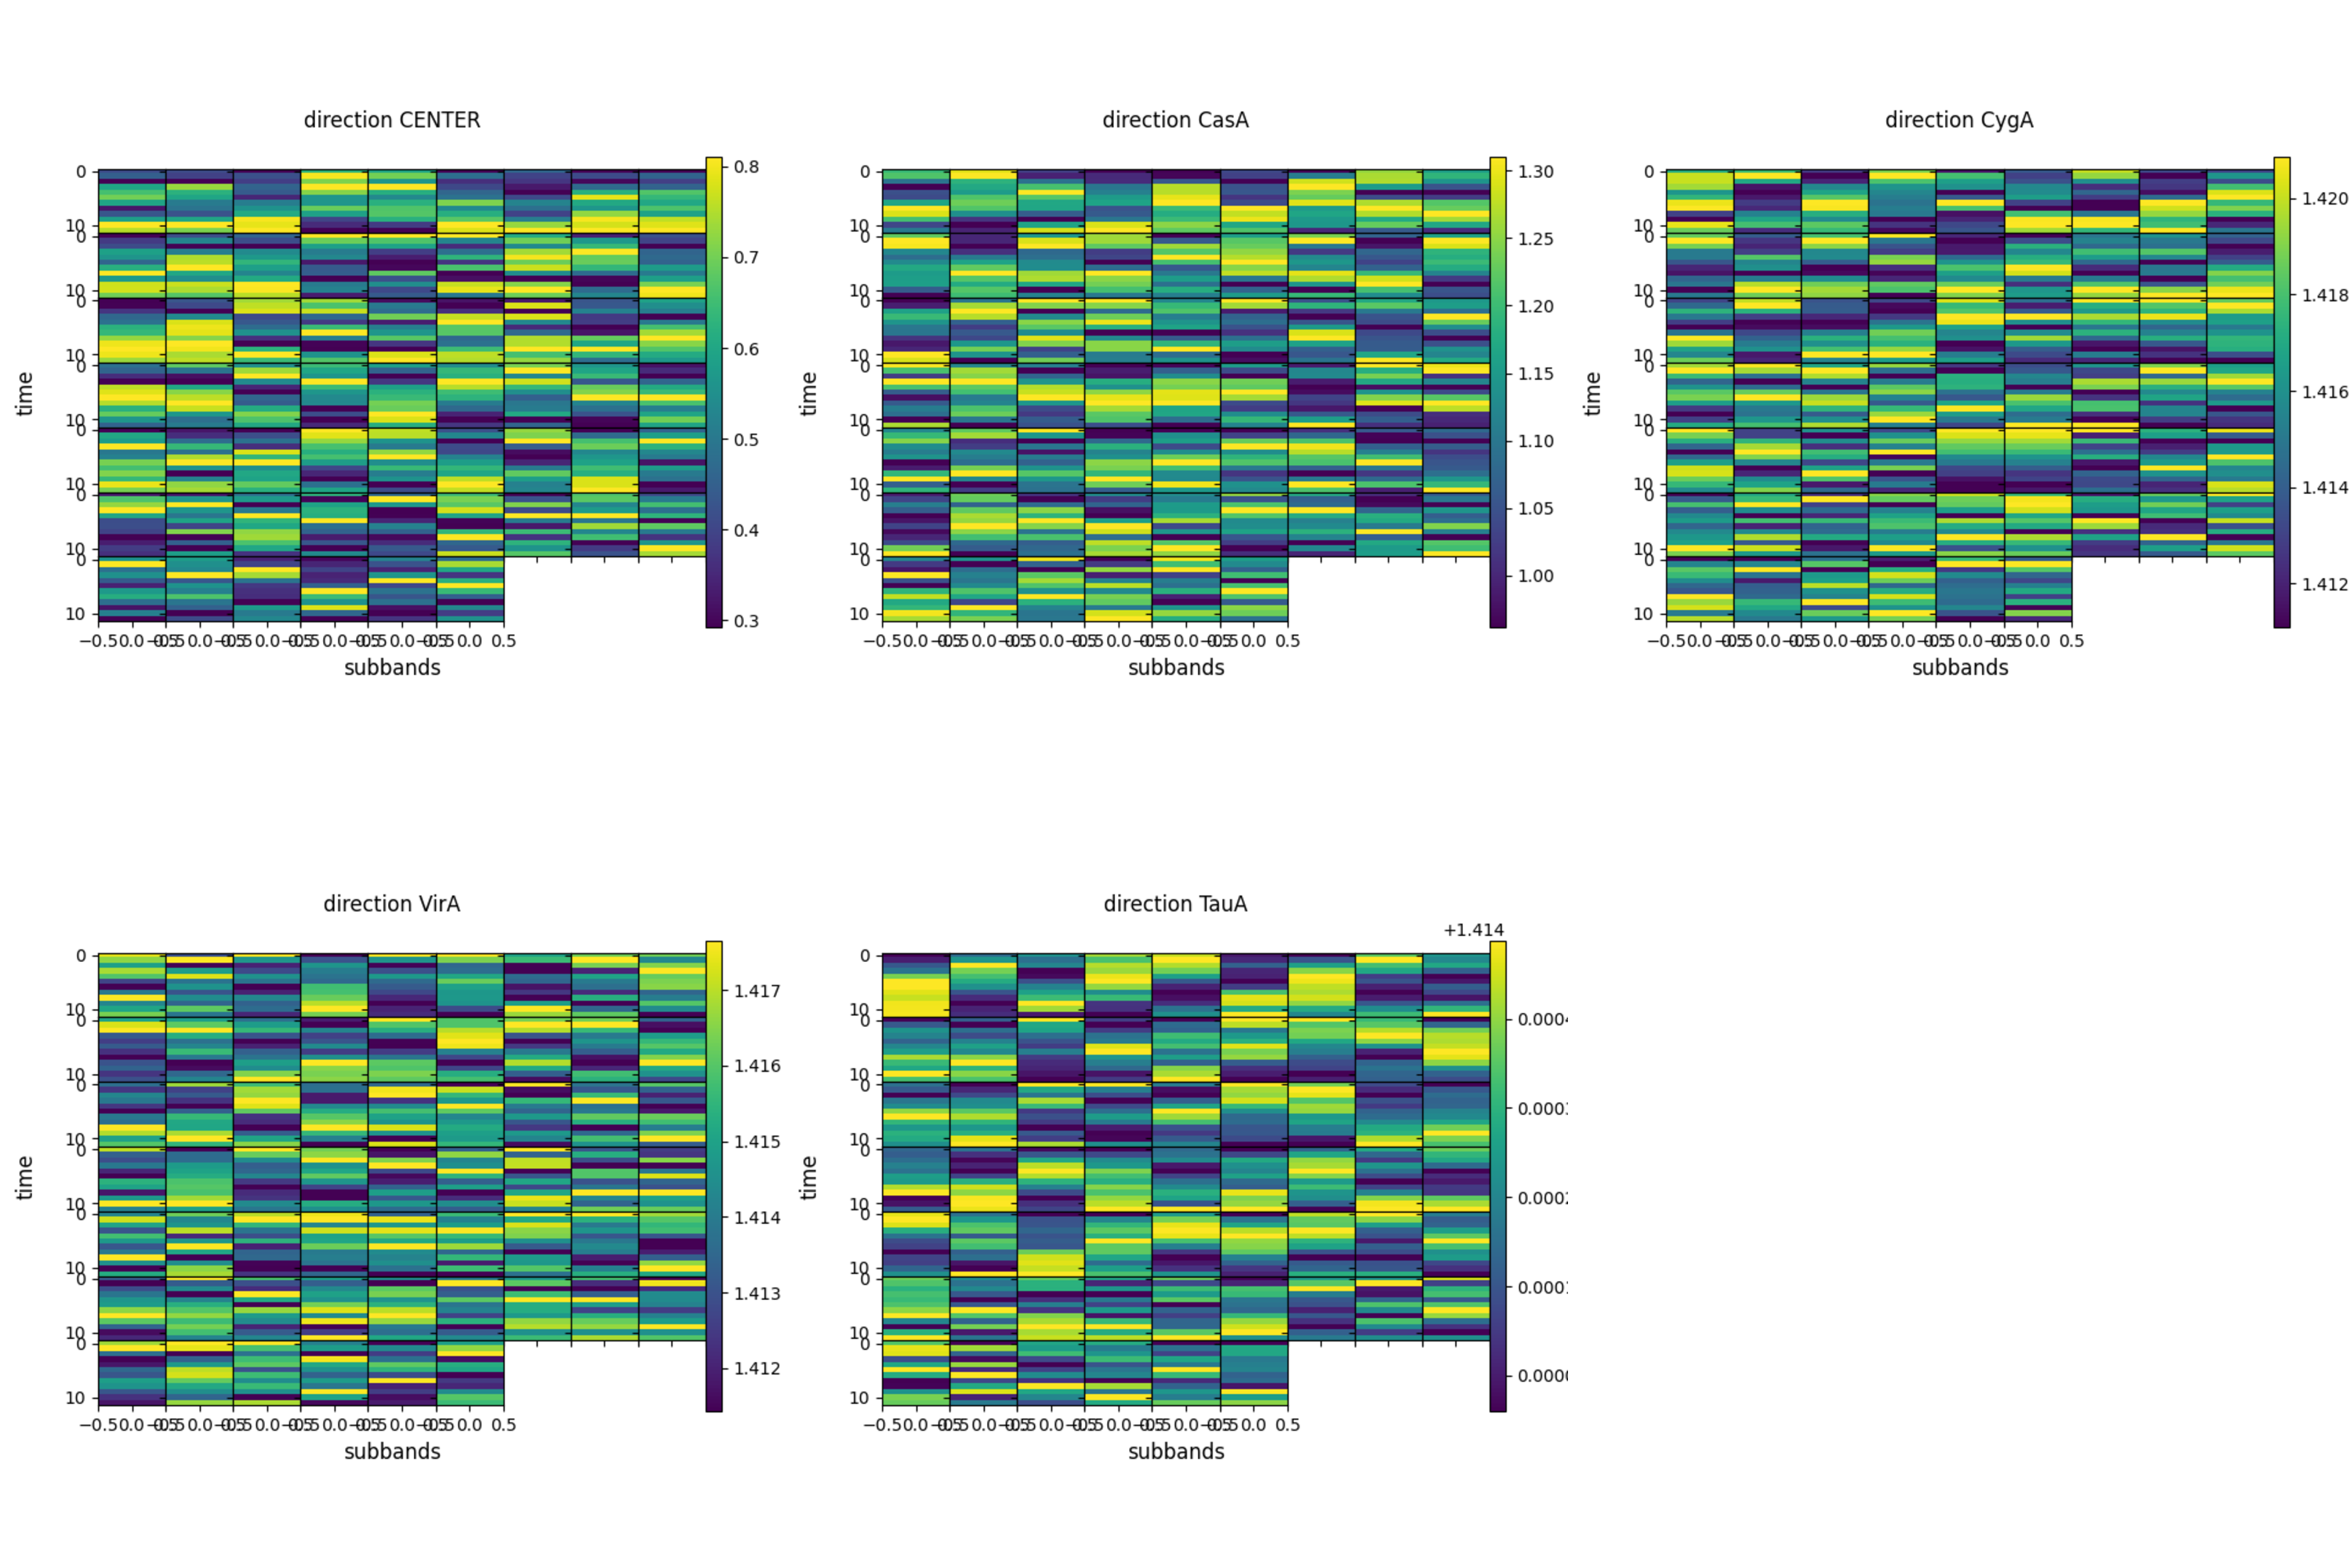
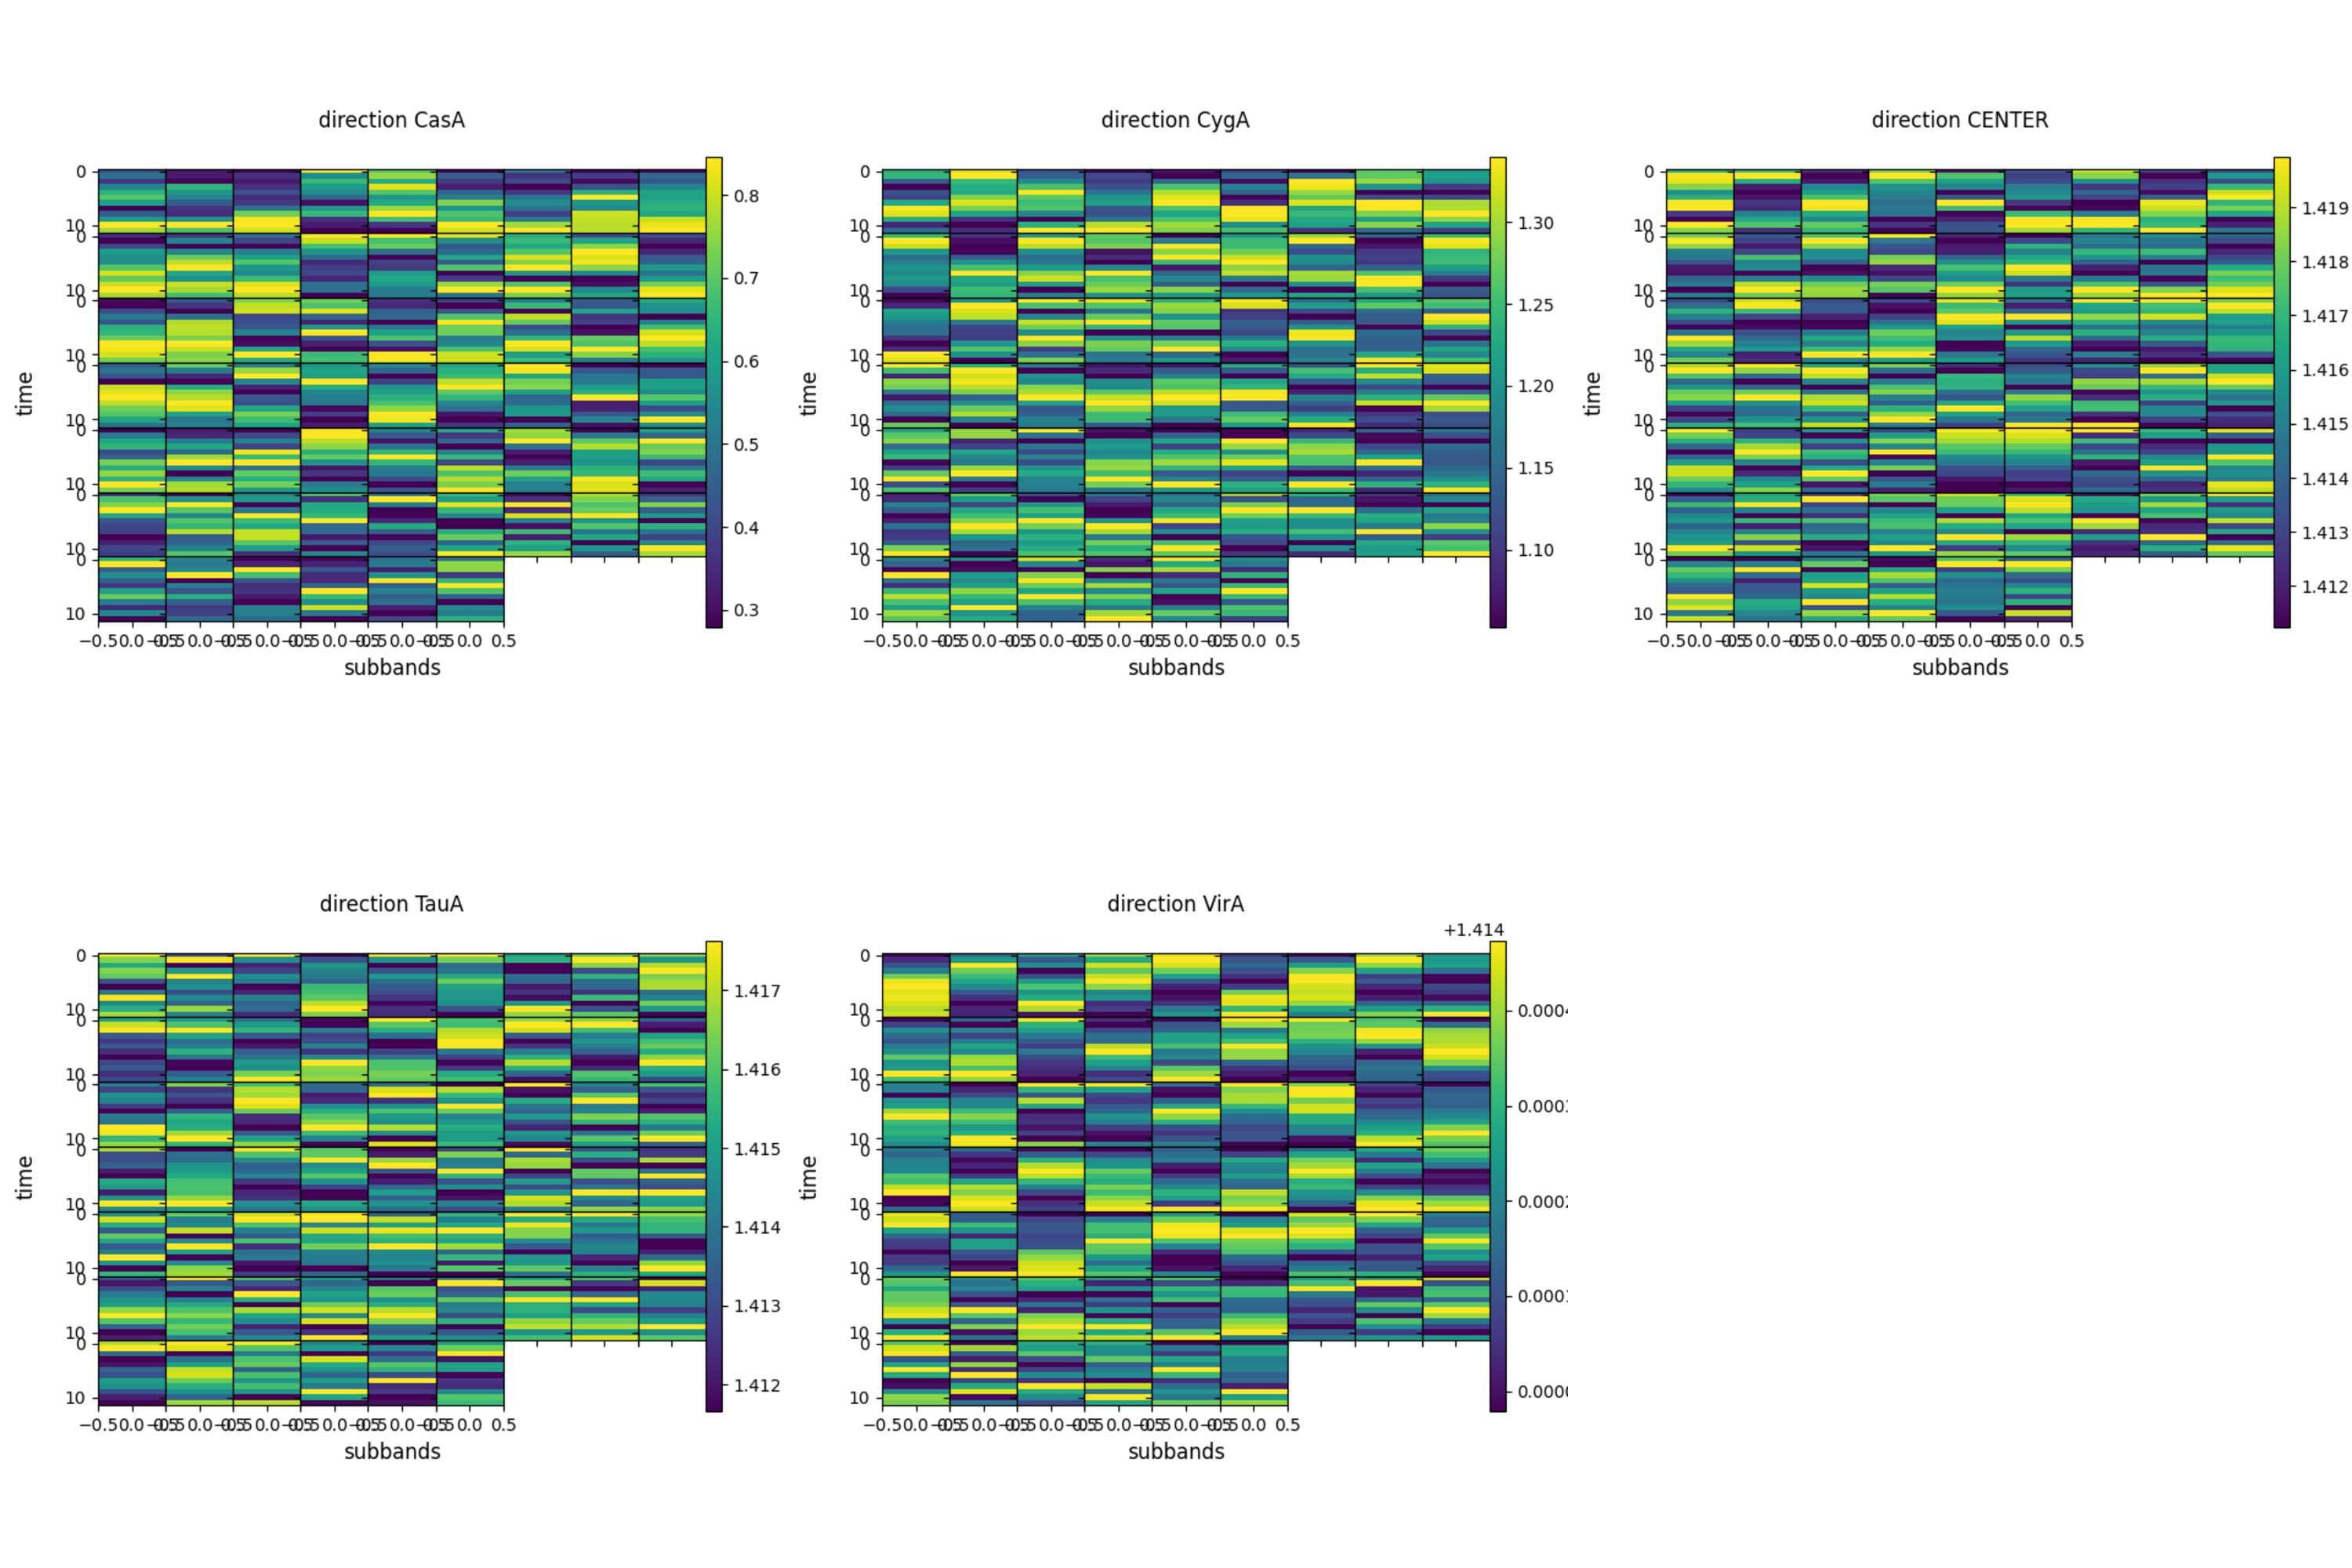
The time difference is prominent when more directions are demixed. Here are the plots of the solution (norm). For HBA, the solutions are more or less same.
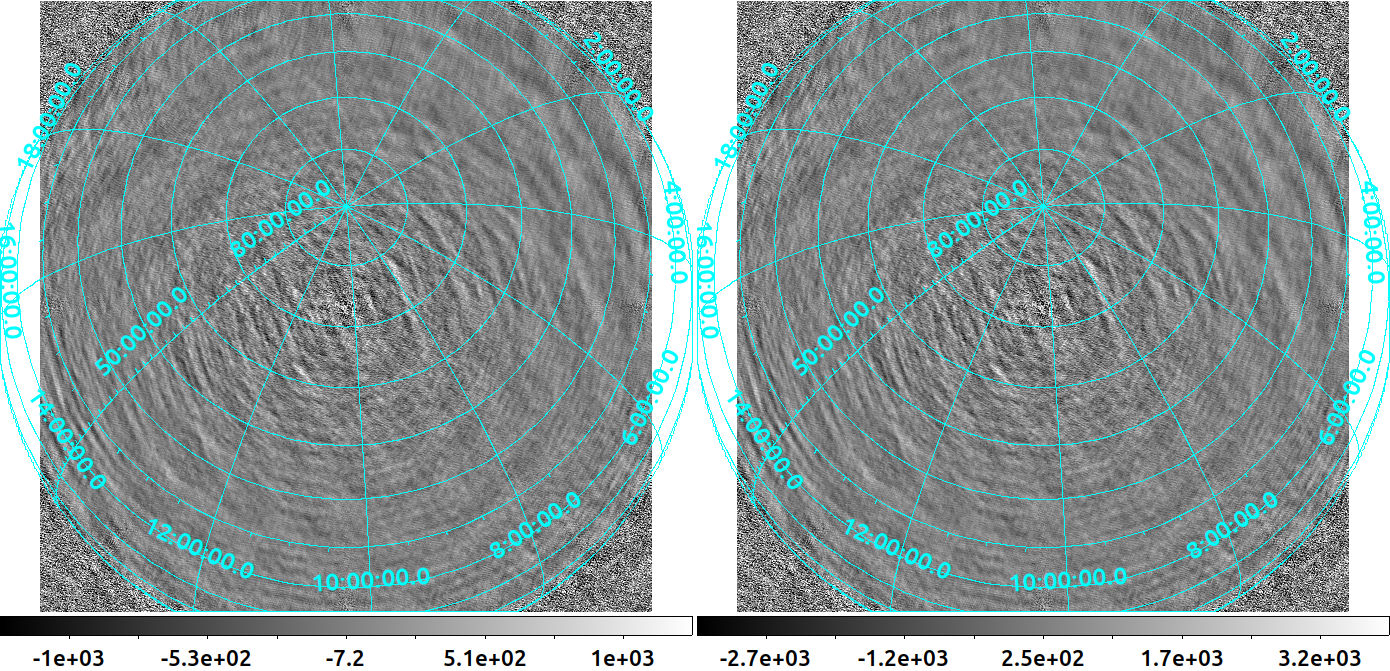
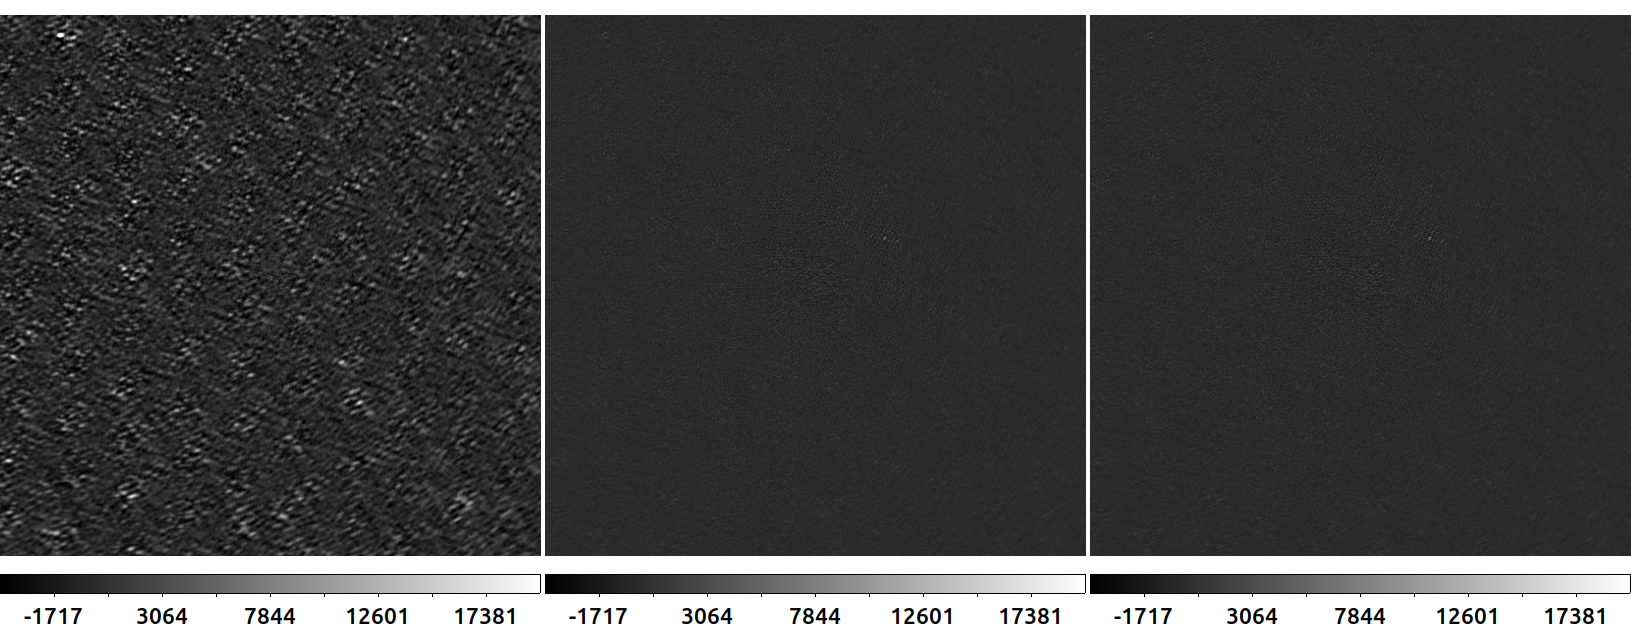
Here are the images (left) data (mid) old demixing (right) new demixing

LBA
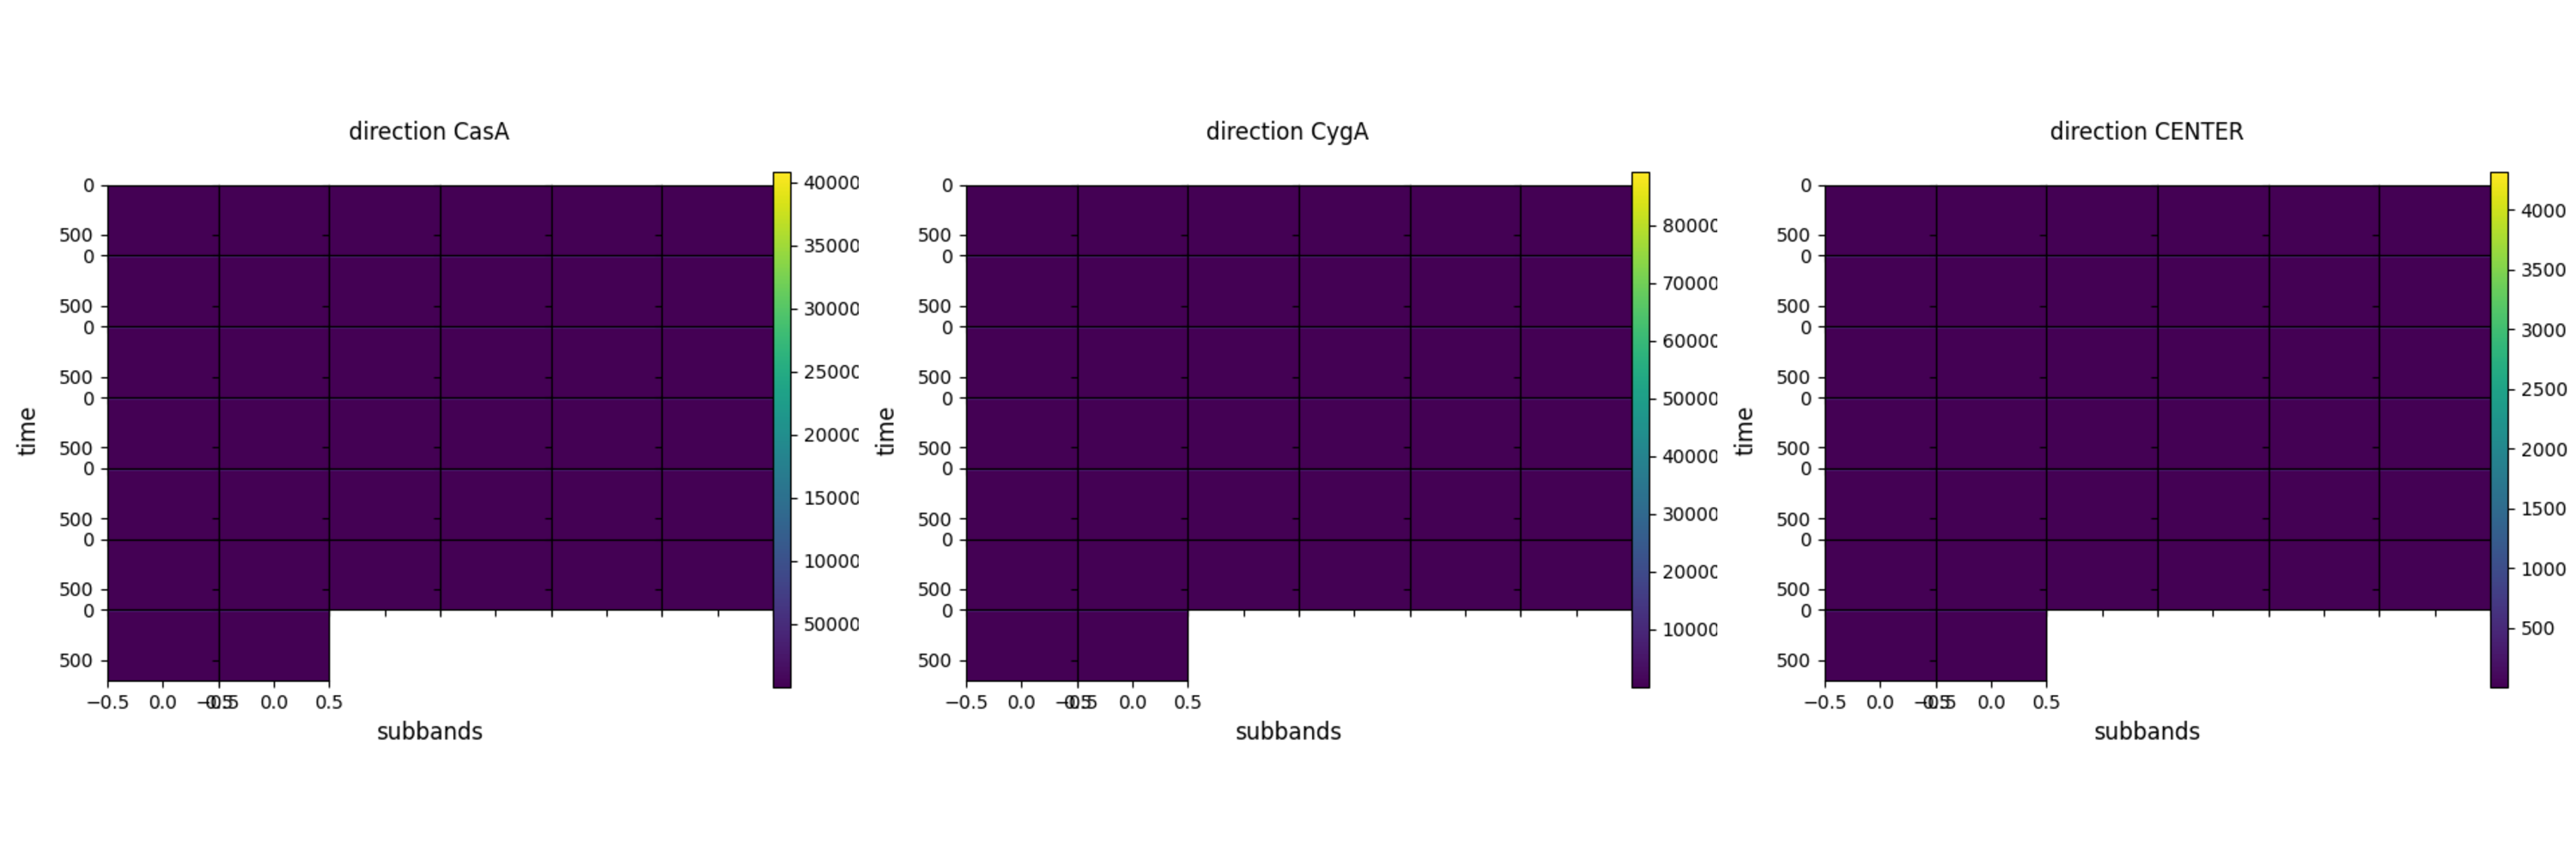
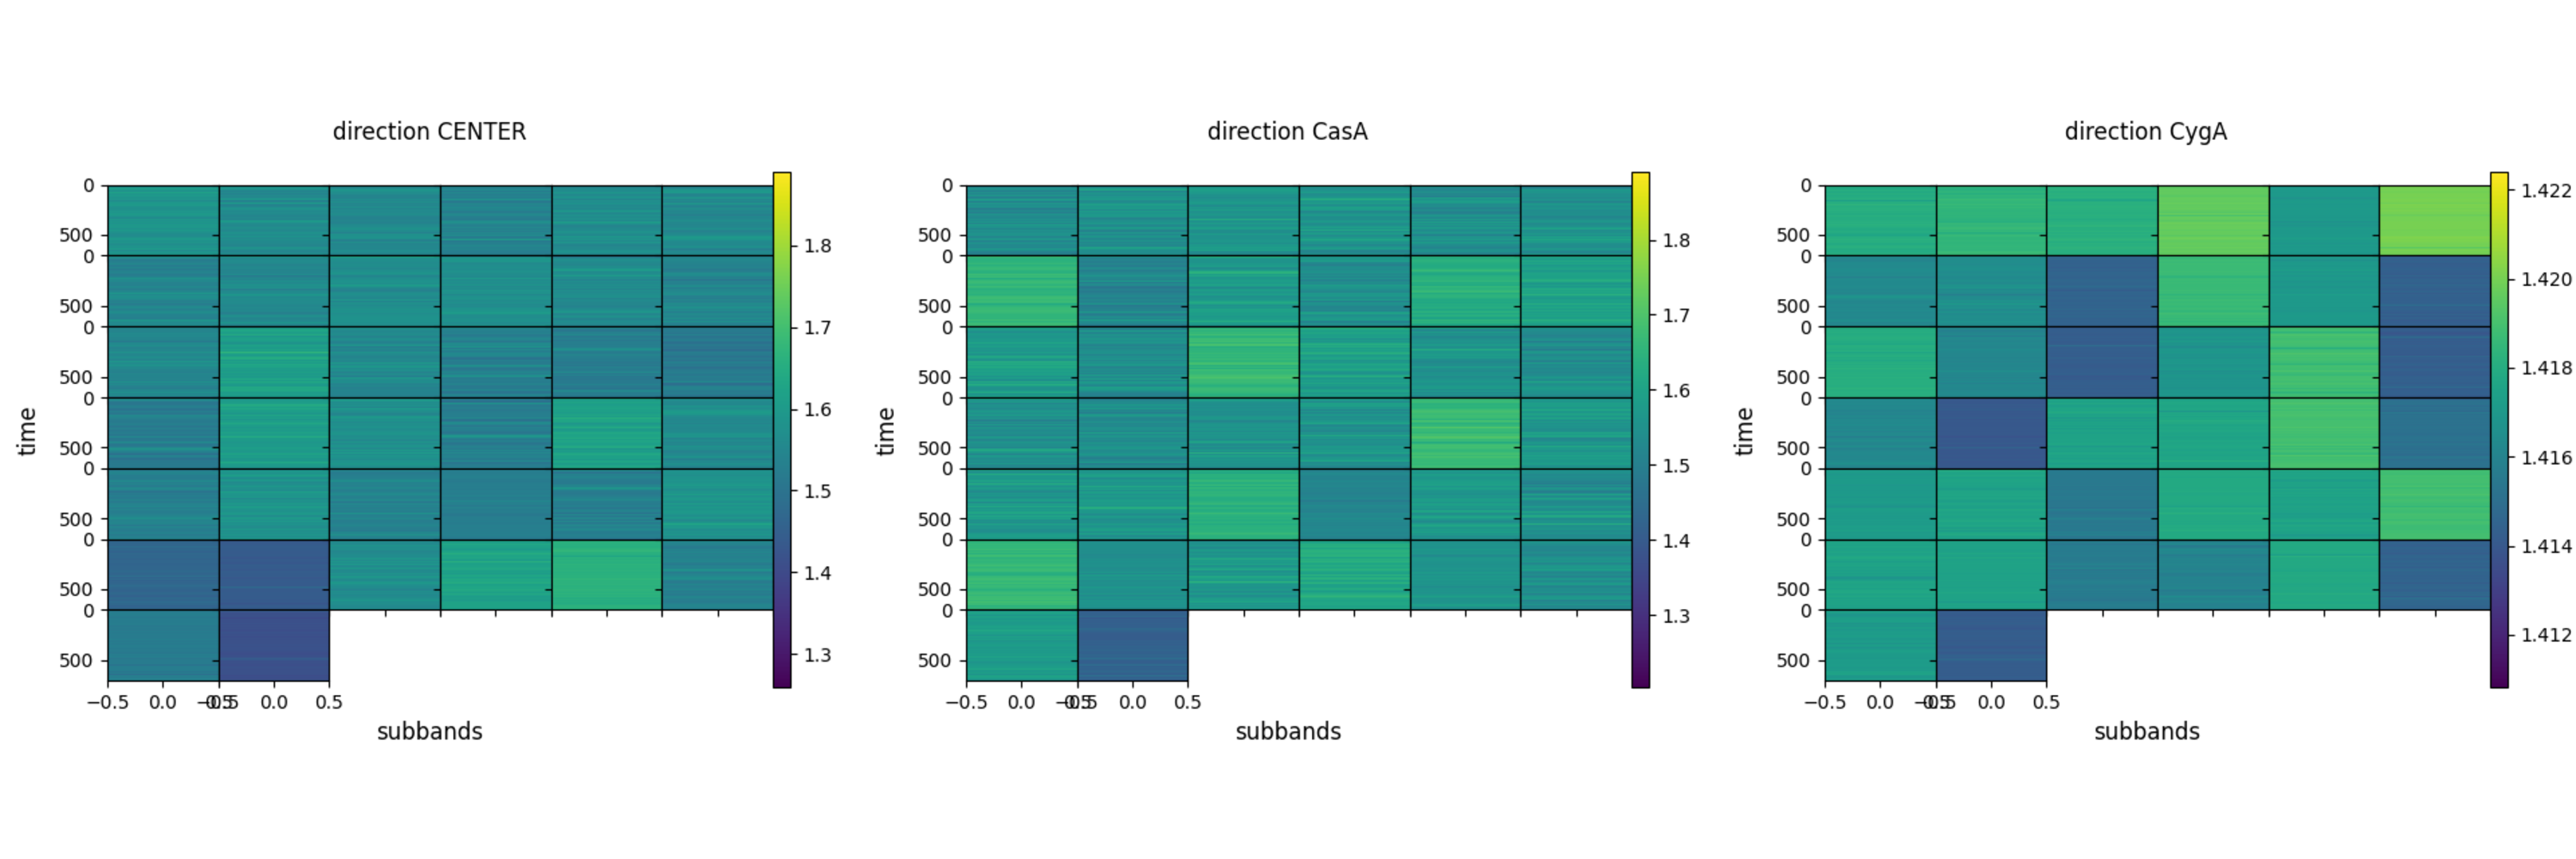
SIngle subbands from L813964 (different pointings) were tested, noteworthy is the frequency, around 14.4 MHz. In all tests, CasA and CygA were demixed (in addition to the target). Here are the solutions for one pointing, (right/top) old (left/bottom) new.

Note that the old demixing gives very high solutions, which is not realistic, and this happens for all LBA data that were tested.
Images before and after with new demixing is shown below. (left) data (right) after demixing.

The difference is not clear, as further calibration is required to correct for phase errors, but the image after demixing is not worse (slightly better).
Summary
- LBA needs the new demixing solver to get stable solutions
- There is an issue with the frequencies used in demixing, it seems the parset keys demixfreqstep and demixfreqresolution has no effect in the number of solutions obtained per subband channels. This needs further investigation.