
...
Assuming you have an account with the correct privileges, using the "Keycloak Login" button and entering the login credentials, upon successful login the TMSS landing page will be displayed showing the scheduling units in the (default) week view:
Interface
Users can navigate TMSS through different menus and tabs. This section aims to present an overview of the items contained in the sidebar menu (which is always visible and can be expanded by clicking on the icon in the top left corner of the screen). These items are: Cycle, Project, Scheduling Unit, Tasks, Workflow, Week View, Timeline and Reports. The figure below illustrates how these entries relate in a hierarchical structure to the entities connected with a given observing project.
...
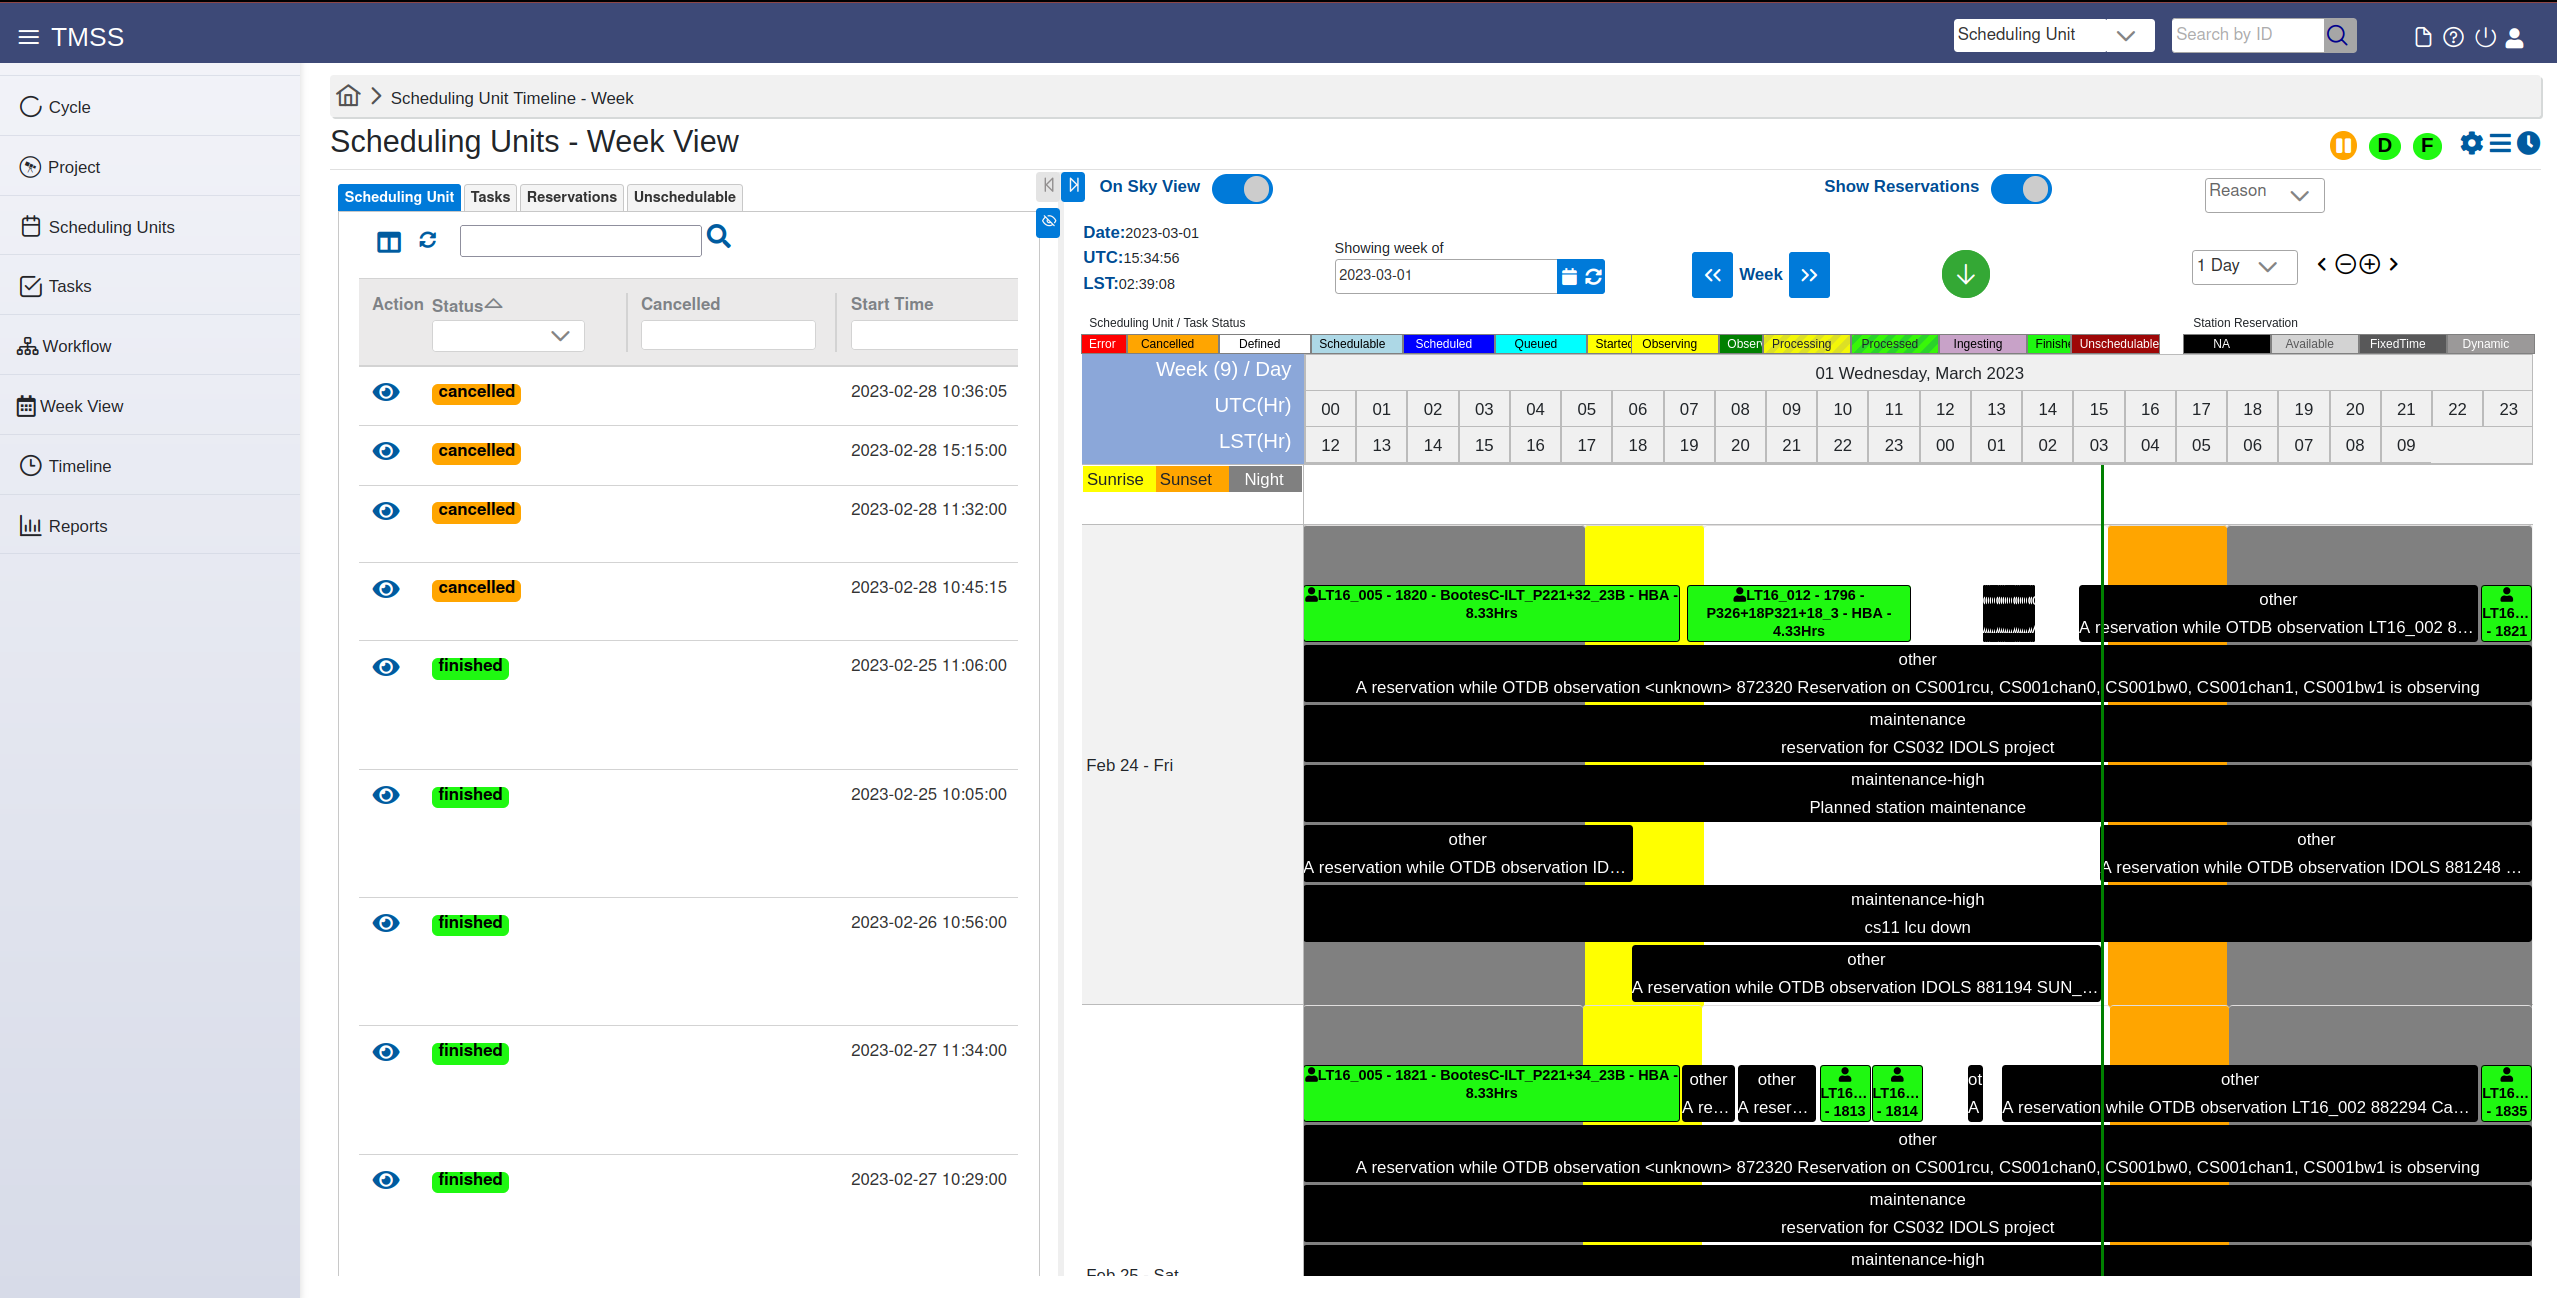
The Week View menu item page displays a complete overview of the dynamical LOFAR schedule. The user can quickly monitor the order and current status of different SUs along with their respective details. Note that the view is filtered, i.e. is only exposed the SUs relevant for the user science projects.
Starting at the top left, the user can see details such as current data and current time in UTC and LST. Next it shows the currently week that is being displayed by TMSS (which shows a range of 10 days). The week can be changed by clicking the calendar icon right next to the yyy-mm-dd display. Next to that is also another way to change the displayed week (the arrows next to the text Week) to scroll a week forwards or backwards. To the right of that a green arrow icon can be found which will reset any zoom-ins and display current time/week if clicked. Next are the zoom-in/out functions. The user can select to what view the user wants to zoom-in/out to (e.g. 12 hours makes the view zoom into a 12 hour view of the selected day in the calendar). All these above mentioned tools are useful for navigating the week view of TMSS.
Then comes the actual calendar view itself. The week view shows tasks and scheduled blocks at the level of scheduling units. At the very top of the calendar there are small boxes which serve as a legend to the display below.
The scheduler starts with the current displayed week and current day, followed by a view of of 24 hrs in 1 hour blocks in UTC time and LST time. Below this view is another small legend on the left that shows in yellow, orange and grey the time slots for Sunrise, Sunset and Night respectively. These colours are displayed behind the SU/Tasks in the week view on the background.
In this week view the user sees 10 days at a time (at the standard zoom view) that are listed vertically. This way the user can see what is scheduled for a full 24 hr period per day for 10 days at a time. There are several blocks with different colours to be seen that change depending on which observations are scheduled. For more information the user can hover over the block of interest to gain more detailed overview for the observation/task in a tool-tip. The black blocks often represent maintenance of specific stations and how long they last, this listed as Not Available (NA).
Timeline (View)
The timeline view is at first very similar to the Week View in terms of legends and header layout. But the main difference here is that instead of dates being vertically displayed and time being horizontally displayed, the timeline view has the dates and time on the horizontal axis, and the pointings on the vertical axis, giving a different overview. Here the user can also select to show only SU, only Tasks or both and group them as such. It also allows to toggling between Sky View and Station View (all accessible from the very top of the page).
Basic Project Administration
Users which have the TMSS user role 'Friend of Project' (FoP; also, the to be implemented Primary Friend of Project user role) will be able to execute actions related to basic project administration. In what follows, we describe a typical workflow for this user role.
This role assumes that a relevant Cycle as well as Project have already been created. The Cycle and Project entities as well as the details of their creation and editing are out of scope for the FoP user role and are described elsewhere in this Manual.
An overall schematic view of the workflow for creating a Scheduling Unit is shown below. More details regarding the observation specifications are described in the following sections.

Project content specification
During each LOFAR Observing Cycle (LC), different observing campaigns corresponding to the set of approved science projects are performed. These can be regular LC projects, long-term projects (LT) or Director Discretionary Time (DDT) projects. In addition there are (special) commissioning or maintenance projects (COM) which can also be part of a cycle, with the purpose of testing new strategies or testing system health.
Scheduling Units
In order to observe the proposed targets, the observing specifications & pipelines from the proposal need to be translated into system parameters that the telescope can understand. In TMSS, this is done via "scheduling units" (SU).
Projects are organized in sets of SUs. A SU is a collection of system tasks (i.e. Observations, Pipelines, Ingest and Cleanup Tasks) with relations for scheduling blocks and sets and handling of the resulting data product outputs. The user specifies the SU and the associated tasks which contain the details about the observing runs to be performed and the associated data
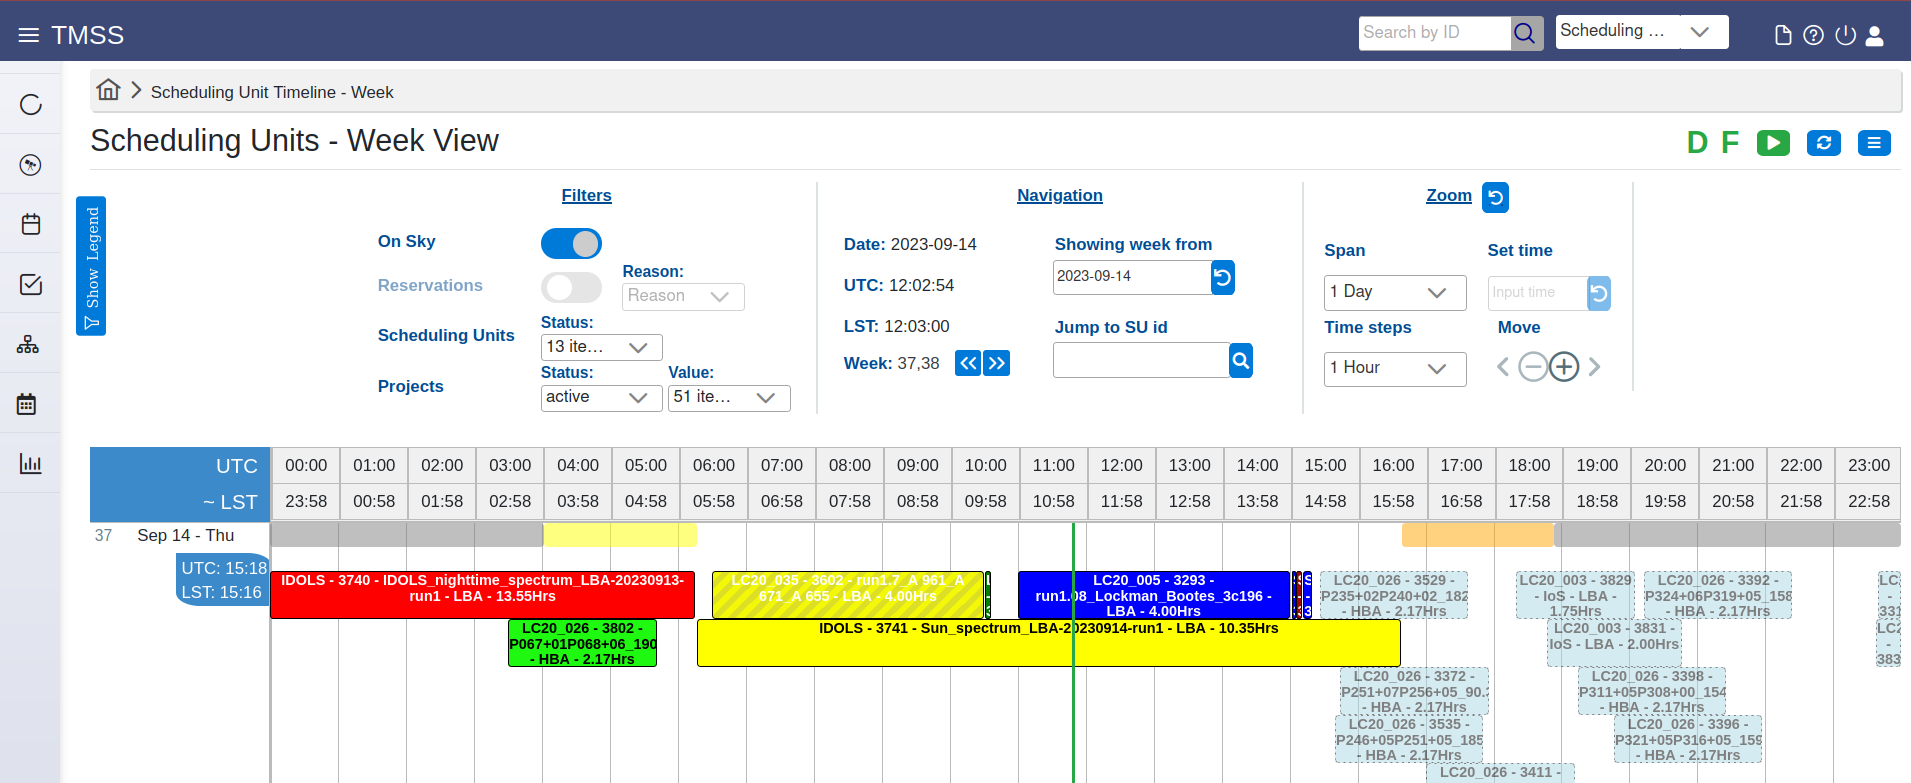
At the far right of the title at the top of the page, there is an indication whether the dynamic and the fixed time scheduling rules are on or off; the corresponding letters (D and F) will be green if the corresponding mode is enabled, red if disabled. The button that follows in the same row is for enabling or disabling the dynamic and fixed time scheduling functionality. Further to its right is the refresh button, and the options button, allowing to add reservations, system issues or SUs.
Below the title bar, there is the settings section, split in three sub-modules: Filter, Navigation and Zoom. The user can filter the view according to on-sky duration, filter on reservation reasons and SU status as well as project status. The Navigation sub-section allows for selecting a week of interest (by using the calendar input field), or search for a SU using its ID. The two buttons at the bottom of this section allow for scrolling +/- 7 days from the current view. The user can reset to the current week by clicking on the button next to the calendar input field. The Zoom sub-section can be used to set the desired span to be zoomed over, using the Span drop-down menu, and select the time to zoom at via the 'Set Time' input field. Using the 'Time steps' drop down one can change the scale of the UTC/approximate LST bar below the settings section. The '+' and '-' icons can be used to zoom in or out interactively by clicking them, and the '< >' arrows fro moving left or right.
To the left of the Filters sub-section is the 'Show Legend' vertical button which will open/close the slider containing the legend explaining the color / hatch scheme of the week view slots.
Below the Filters section is the time slider displaying the UTC and the approximate LST.
Below the time slider is the section which contains the week view. It has a tabular grid background layout; the first column displays the date and day of each row, as well as the week number. The other columns can be re-scaled in width (as mentioned above) and represent time increments; their total number as well as the time span shown are determined by the settings selected in the zoom filter section.
The SUs are represented as blocks overlaid onto the grid with their color indicating their status (yellow - observing, blue - scheduled etc. as outlined in the legend) and the containing text showing a few details: the project a SU belongs to, its ID and duration in hours. There are also blocks representing various system reservations. When the user hovers with the mouse pointer over a particular scheduling unit, a pop-up window appears listing the SU ID as well as an overview of its details. If a user clicks on a scheduling unit, a window appears to the right of the week view containing a more extensive listing of the SU as well as its associated tasks. In the top right corner of that window there are additional controls: to go to the SU view for that SU, cancel it, unpin its data as well as a button to close the details window. The week view also displays a fixed vertical bar marking the current UTC time as well as a blue vertical bar moving with the mouse pointer to indicate its UTC position. The exact value of the pointed UTC can be read off in the first column to the left. The user can also scroll the week view up, down or left, right using the mouse or the keyboard arrow keys.
Basic Project Administration
Users which have the TMSS user role 'Friend of Project' (FoP; also, the to be implemented Primary Friend of Project user role) will be able to execute actions related to basic project administration. In what follows, we describe a typical workflow for this user role.
This role assumes that a relevant Cycle as well as Project have already been created. The Cycle and Project entities as well as the details of their creation and editing are out of scope for the FoP user role and are described elsewhere in this Manual.
An overall schematic view of the workflow for creating a Scheduling Unit is shown below. More details regarding the observation specifications are described in the following sections.
Project content specification
During each LOFAR Observing Cycle (LC), different observing campaigns corresponding to the set of approved science projects are performed. These can be regular LC projects, long-term projects (LT) or Director Discretionary Time (DDT) projects. In addition there are (special) commissioning or maintenance projects (COM) which can also be part of a cycle, with the purpose of testing new strategies or testing system health.
Scheduling Units
In order to observe the proposed targets, the observing specifications & pipelines from the proposal need to be translated into system parameters that the telescope can understand. In TMSS, this is done via "scheduling units" (SU).
Projects are organized in sets of SUs. A SU is a collection of system tasks (i.e. Observations, Pipelines, Ingest and Cleanup Tasks) with relations for scheduling blocks and sets and handling of the resulting data product outputs. The user specifies the SU and the associated tasks which contain the details about the observing runs to be performed and the associated data processing. SUs that are being created and are being specified are in the Draft state: they can still be edited. In order for a SU to be schedulable its status should be manually set to Blueprint (after which it cannot be edited anymore). The following table shows the list of the possible statuses that a SU can attain:
...
| Field name | Content | Examples |
|---|---|---|
| Scheduler | Type of scheduling to use. Default is to use the dynamic scheduler, so scheduling units are picked up automatically, but it is possible to specify fixed time scheduling. | Dynamic |
| time at | Run observations at this specific time. Only use this if really required, e.g., the target is also observed with another telescope. Specifying this option circumvents priority scheduling and should be used with care. | |
| time after | Minimum start time of this scheduling unit. Default: start of cycle | 2021-06-01 00:00:00 |
| time before | Maximum end time of this scheduling unit. Default: end of cycle | 2021-11-30 23:59:59 |
| time between | Only schedule within the time windows specified here. More time-windows can be specified by pressing the + button below. This can be used to distinguish observations that should run monthly be specifying a few days where these observations could run. | From: 2021-07-08 00:00:00 Until: 2021-07-10 23:00:00 |
| time not between | Do not schedule within the time windows specified here. More time-windows can be specified by pressing the + button below. | From: 2021-07-08 00:00:00 Until: 2021-07-10 23:00:00 |
| Daily | require_day : Day time observations. Run when the sun is higher than 10 degrees above the horizon at the Superterp. require_night : Night time observations. Run when the sun is lower than 10 degrees above the horizon at the Superterp. avoid_twilight : Avoid sunrise and sunset. Run when the sun is higher than 10 degrees above the horizon at the Superterp, or lower than 10 degress below the horizon. | |
| transit_offset | Offset in (UTC) seconds from transit for all target beams in the observation. Alternatively, use you can specify the reference pointing as the reference for transit. When the observation is split into shorted chunks to be observed at different LST ranges. Please take into account a one minute gap between subsequent observations. | from -7200 to 7200 from -7200 to -3600 from 3600 to 7200 |
| min_distance | Minimum distance to the Sun, Moon and Jupiter (latter mostly relevant below 30 MHz) in degrees (backend uses radians). Current default 30, or 28.64 degrees | Sun: 30 Moon: 30 Jupiter: 30 (< 40 MHz ) else 15 |
| min_elevation.target | Minimum elevation for all SAPs in the target observations | |
| min_elevation.calibrator | Minimum elevation for the SAP of all calibrator observations | |
| Reference pointing | If true, will be used for transit_offsetscheduling calculations taking into account the transit_offset Note: If used, the reference pointing direction should be identical to the tile beam pointing direction (for HBA). | enabled=false enabled=true |
...
| Task Parameter | Present in these strategies | Description | Examples |
|---|---|---|---|
| Duration | All except BF FE - Ionospheric Scintillation and FE RT Test | Observation duration in hour:min:sec. For HBA strategies there are additional duration fields for the calibrators and/or additional targets/beam pointing. Similarly some modes have Target Duration which is given in seconds. | 00:02:00 (hour:min:sec) 28800 (sec) |
| Observation Description | All except BF FE - Ionospheric Scintillation and FE RT Test | Usually target (and/or calibrator) name | OOO.O _Target_name_ FRB YYYYMMDDA Paaa+01 & Paaa+02 |
| Pipeline Description | All except BF FE - Ionospheric Scintillation and FE RT Test | Usually target pipeline (and/or calibrator pipeline) name | oOOO.O _Target_name_ FRB YYYYMMDDA/pulp Paaa+01/TP |
| Target Pointing | All except BF FE - Ionospheric Scintillation and FE RT Test | Define pointing to target(s and/or calibrator(s)) given in Angle 1 (RA), Angle 2 (DEC), Reference frame (J2000) and target name | Angle 1: 02h31m49.09s Angle 2: 89d15m50.8s Reference frame: J2000 Target: _Target_name_ |
| Digifil options | BF CV FRB | Relevant options for siggle-pulse searches | DM: 0.0001 Nr of Frequency Channels: 320 Coherent Dedispersion: true Integration time: 4 |
| Raw output | BF CV FRB and BF CV Timing Scintillation | Whether to include the raw data in each output data product | false true |
| Sub-band per file | BF CV FRB and BF CV Timing Scintillation | The maximum number of sub-bands to write in each output data product. | 20 |
Optimize period and DM | BF CV Timing Scintillation and BF Pulsar Timing | false true | |
Sub-integration time | BF CV Timing Scintillation and BF Pulsar Timing | 10 | |
Frequency channel per file | BF CV Timing Scintillation | Number of frequency channels per part (multiple of subbands per part). | 120 |
| Duration FE (1..4) | BF FE - Ionospheric Scintillation, FE RT Test and Solar Campaign | Duration of (one of the) the fly's eye (FE) observation in seconds. Needs to fit within the overall SU duration. | 300 (sec) |
| Description FE (1..4) | Solar Campaign | IPS FE1 | |
| Pointing FE (1..4) | Solar Campaign | Define FE pointing given in Angle 1 (RA), Angle 2 (DEC), Reference frame (J2000) and IPS name | Angle 1: 02h31m49.09s Angle 2: 89d15m50.8s Reference frame: J2000 Target: _Target_name_IPS |
| Frequency | IM HBA 1 beam and IM LBA 1 beam | Frequency range of the observation, i.e. bandwidth covered. | LBA: 21.4-69.0 HBA: 120.2-126.7,126.9-131.9,132.1-135.3 etc. |
| Sub-bands | IM HBA 1 beam and IM LBA 1 beam | Sub-band numbers specification (alternative to frequency). For Range enter Start and End separated by 2 dots. Multiple ranges can be separated by comma. Minimum should be 0 and maximum should be 511. For example 11..20, 30..50 | false true HBA: 104..136,138..163,165..180,182..184,187..209,212..213, etc. |
| Run adder | IM HBA 1 beam, IM LBA 1 beam, IM HBA LoTSS 2 beam and IM LBA LoDSS 5 beam | Do/Don't create plots from the QA file from the observation | false true |
| Tile Beam | IM HBA LoTSS 2 beam | HBA Only, insert pointing of the tile beam given in Angle 1 (RA), Angle 2 (DEC), Reference frame (J2000) and target name | Angle 1: 02h31m49.09s Angle 2: 89d15m50.8s Reference frame: J2000 Target: Paaa+01Paaa+02REF |
| Filter | IM LBA 1 beam | Bandpass filter applied | LBA_10_90 HBA_110_190 |
| Antenna set | IM LBA 1 beam | Select the antenna mode to observe with | LBA_SPARSE_EVEN HBA_DUAL_INNER |
Time averaging steps | IM LBA 1 beam, IM LBA 1 beam and IM LBA Survey 3 beam | Factor used to average the data in time | 2 |
Freq averaging steps | IM LBA 1 beam, IM LBA 1 beam and IM LBA Survey 3 beam | Factor used to average the data in frequency | 3 |
| Demix pipeline | IM LBA 1 beam and IM LBA Survey 3 beam. | Given in several drop-down menus per target/calibrator where the user can select what sources to demix. Note that the time step and frequency step in this menu have to be multiples of the previously defined averaging steps. | Sources: CasA, CygA, HerA, HydraA, TauA, VirA Time step: 8 Ignore Target: false Frequency step: 64 |
Edit a scheduling unit
Editing a scheduling unit is done in the most straightforward manner by finding the associated scheduling set filtering in the Scheduling Units tab in TMSS or simply by searching for the SU name in the search bar of TMSS. Then selecting the correct scheduling unit by clicking the
'eye' icon on the left-hand side of the table. Once the user enters the 'Scheduling Unit - Details' menu, make sure you are in the 'Draft' tab of the 'Task Details' section. Now if the user wants to change the global description of the scheduling unit or, for example, wants to change the project or description, one can click the 2nd icon on the top right (pencil and paper icon) to change the SU's Details. From this view, the user can also change the Task Details by selecting the appropriate task that needs changes and clicking the edit button that is right from the Task Details header. Below the Task Details section one can see the familiar Observation Specifications as shown during the SU creation and these can be changed accordingly as well on a SU level.
Tasks and sub-tasks
The tasks are already defined when creating a scheduling unit, and the standard form of the tasks is already created for the given strategy chosen for the SU. Each observation strategy has a unique set of parameters that ultimately define these tasks. In the most general case, tasks are divided in different categories that are: Observation, Pipelines and Ingest. Most often the Observation tasks (depending on the strategy) consist of the Target observations (the number depending on how many beams the strategy has) and some Calibrator observation. The Pipeline tasks consist of a pre-processing pipeline associated with each calibrator, and a pre-processing pipeline for each beam in the strategy. Lastly the Ingest tasks consist of ingesting the pre-processed data products to the indicated destination (defined in the project) and a cleanup which removes the data from the disk. Each of these tasks can be viewed in their 'Task - Details' through the eye icon and their sub-parameters can be inspected and changed.
Observation Task Specification
Within an Observation Task the user can view and edit the observation specification, such as the station set-up, observation duration etc. Very similar so what was written before during the SU creation
Pipeline Task Specification
Within a Pipeline Task the user can view and edit the parameters for the pre-processing pipeline such as averaging factors, RFI flagging strategy and cluster details.
Ingest Task Specification
Within a Ingest Task the user has to make sure that the predecessor tasks are correct before the ingest and cleanup happens.
Bulk Scheduling Units Specification (Scheduling Sets)
During the creation of a SU, the user can add the SU to a Scheduling Set which can be used as an easy filter in the SU menu to search for the appropriate tasks, but if for example the one pointing the SU has been created for is part of many different SUs in a project, then it has to be sorted into the correct Scheduling Set belonging to that one project. A user can also create multiple SUs at once that are then belonging to such a scheduling set by using the ![]() button. This introduces the following menu to the user:
button. This introduces the following menu to the user:
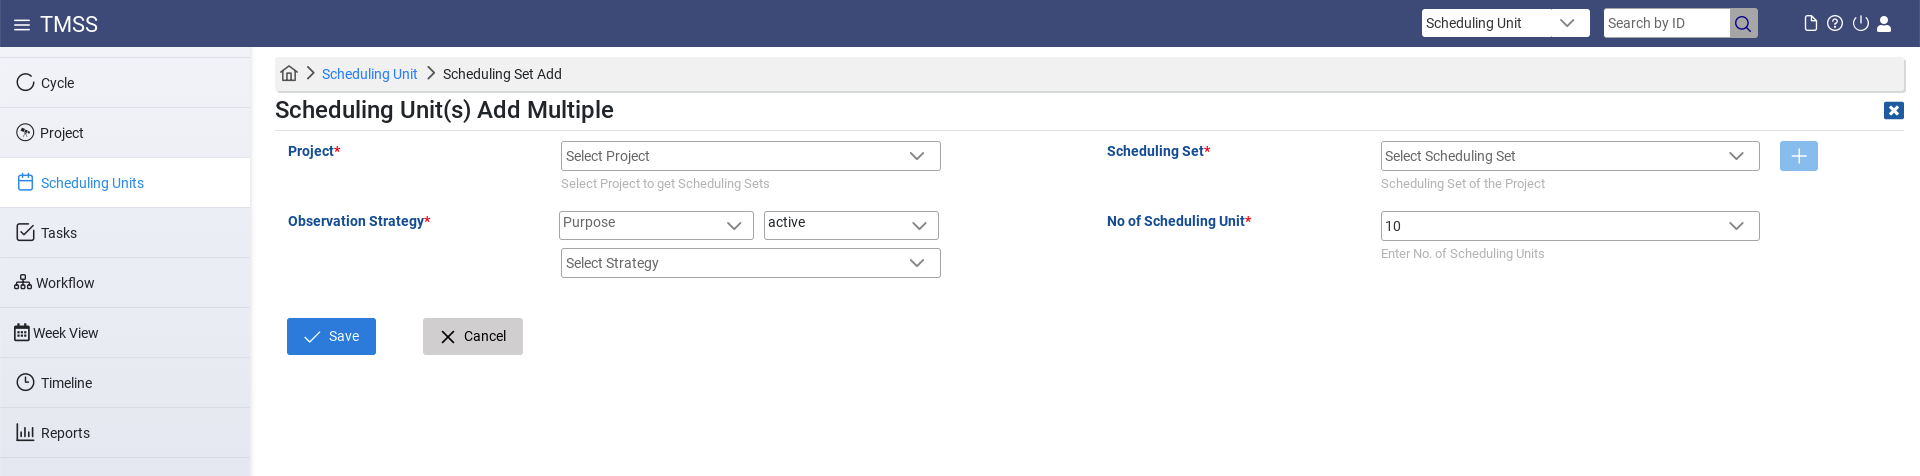
From this menu the user can specify the creation of scheduling units in a similar way as before but with the addition that they can select how many scheduling units one wants to make that belong to the same scheduling set. Once the appropriate scheduling set is chosen, this menu unfolds and turns into the view as seen below.
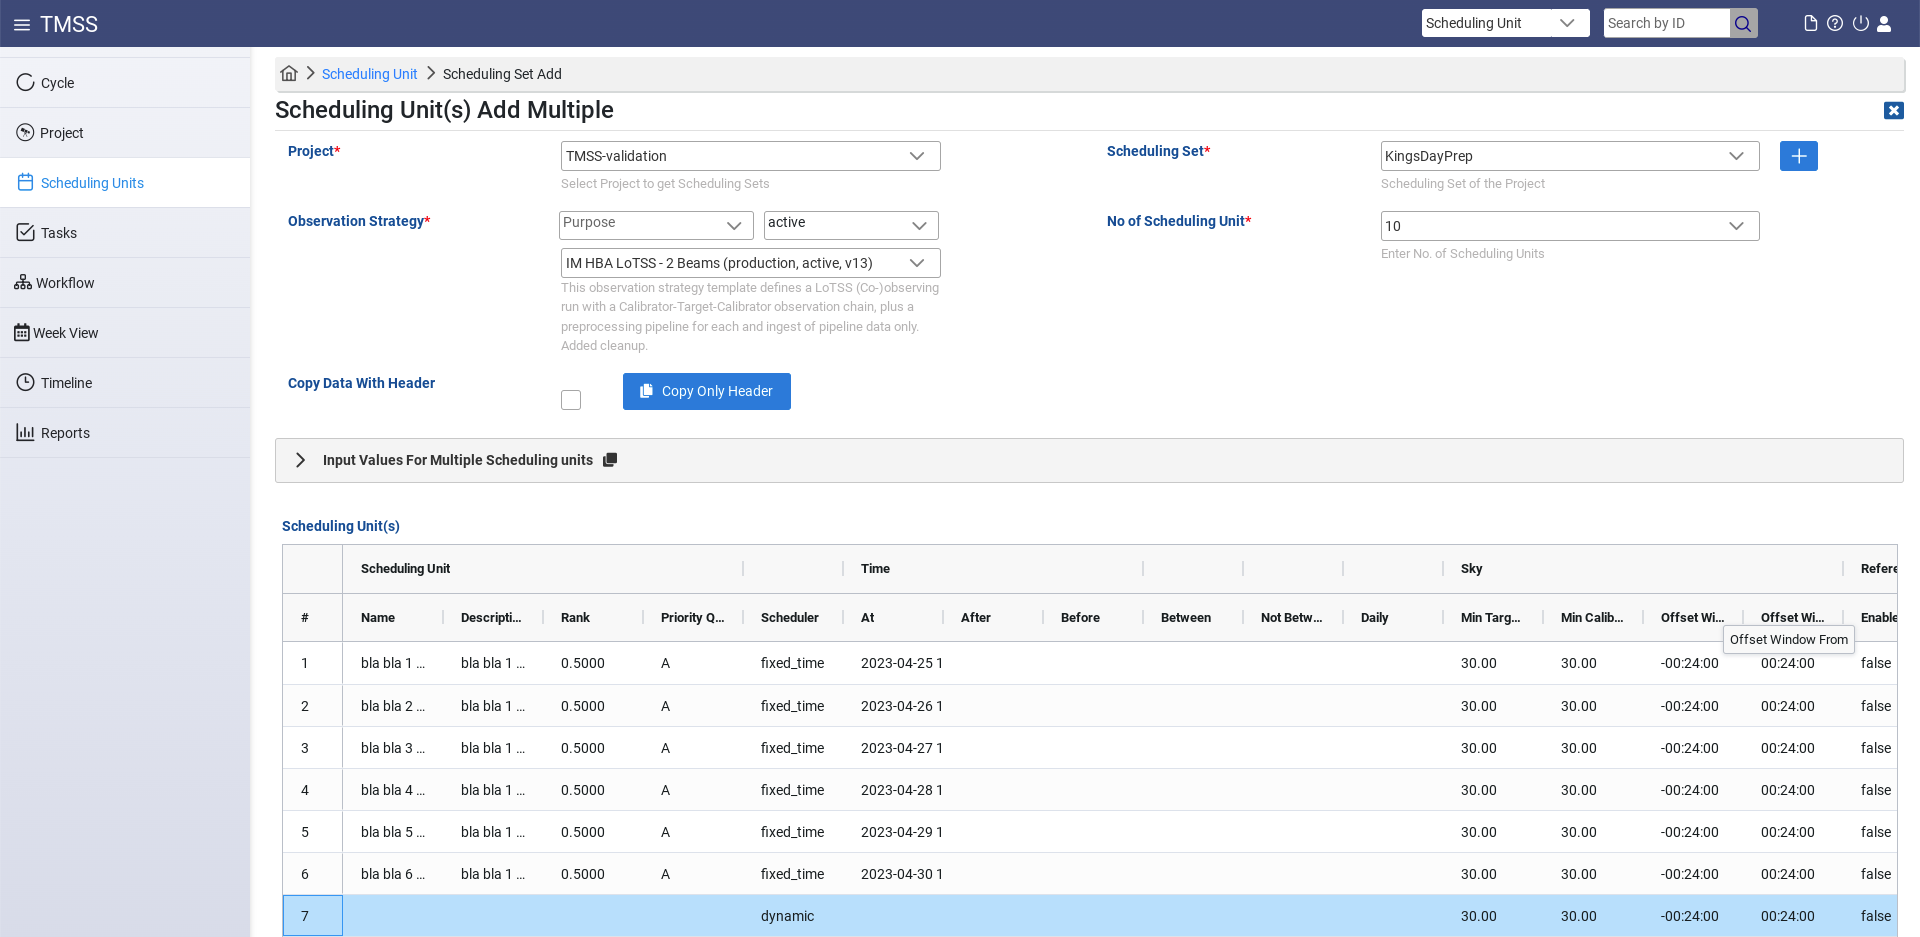
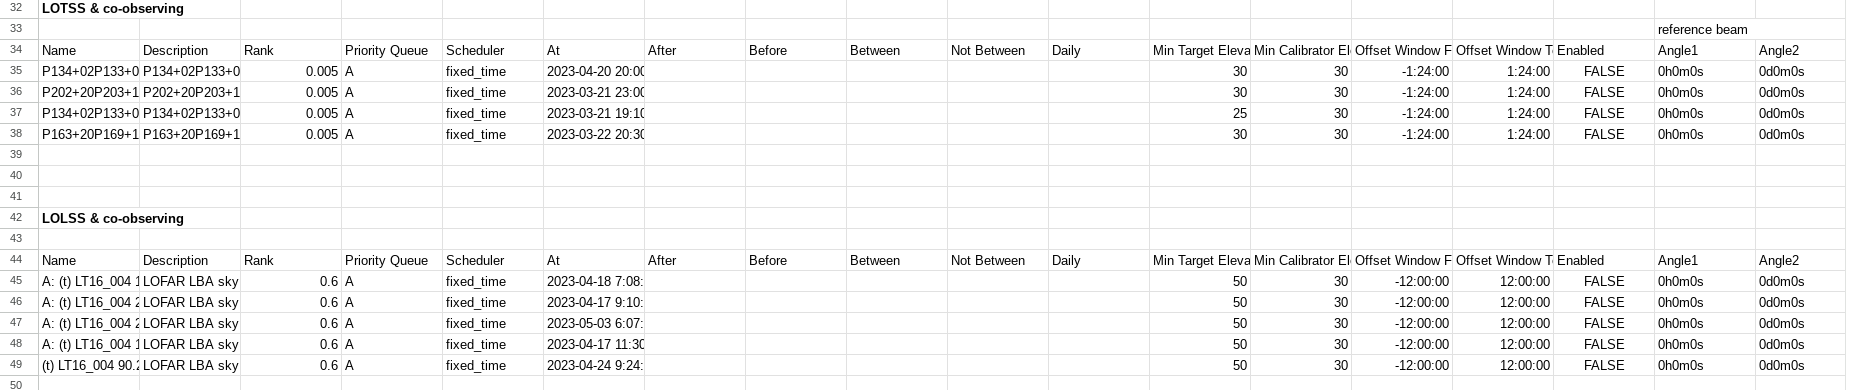
This way it is easiest to define all the appropriate tasks at once, plus through this view the user can easily copy paste the first SU's information into a spreadsheet and perform all needed editing of the fields and finally copy back into the TMSS table view. An example of such a spreadsheet is shown below.
Submission of Scheduling Units
The user may notice that after the creation of a SU from the previous sections the "Type" of the Tasks in the "SU - Details" view are set to Draft. The Draft status allows the user to still edit a task or scheduling unit before submission. However, in order to make a SU schedulable , it has to be properly submitted. This is done by setting the scheduling unit to Blueprint. Once a task has been set to Blueprint the tasks cannot be edited and can be scheduled immediately, so please first make sure all settings are correct. It will be scheduled at an appropriate time which should be visible in the "Week View". To create a blueprint, click on the ![]() icon:
icon:
- On the scheduling unit page
- By first selecting scheduling units on the scheduling unit list page
- By first selecting scheduling units from the list on the project page
Re-submission of Tasks after Failure
It is possible that a task after observing has failed. This can be either due to not meeting the requirements specified in the tasks or due to external circumstances. This requires the FoP to add more tasks to the SU and repeat the process mentioned above. One can add new tasks in a SU by being in the "Scheduling Unit - Details" menu and then clicking on the 'paper-and-pencil' icon next to the "Task Details" section. Or, copy the failed blueprint of the SU to a (renamed) draft SU and blueprint it. In this case, make sure that the new SU does not retain any fixed timeslot from the failed copy. Also, make sure that you open a ticket in the Helpdesk for any archived data related to the failed SU to be removed from the LTA.
This concludes the Observation Specifications description. However, this is not where the responsibilities of the FoP end, as after the observation was successful the FoP has to do the Reporting.
Reporting
Currently the Reporting tab in TMSS is incomplete and reporting on a scheduling unit level is not yet possible. We will be using the Jira system for handling observation reports. After the observations and subsequent processing are completed, the PI will be notified via the Jira ticket associated to the project and the requested data products will be made available through the Long Term Archive (LTA) as soon as possible.
The Radio Observatory will not have the opportunity to check all data manually before it is exported to the LTA, although some automatic diagnostics are generated for system monitoring, and offline technical monitoring will be carried out regularly. The FoP or the expert user in charge of project support will send to the project PI a notification after each observation with detailed information on where to find the relevant plots. The project team is encouraged to analyze the data, at least preliminarily, soon after the observations, and to get in touch through the ASTRON helpdesk about any possible problems. Observations that turn out to have an issue that makes them unusable may be considered for only one re-run, as soon as the observing schedule allows.
...
| HBA Only, insert pointing of the tile beam given in Angle 1 (RA), Angle 2 (DEC), Reference frame (J2000) and target name. Should be between (average of) the SAP pointings. | Angle 1: 02h31m49.09s Angle 2: 89d15m50.8s Reference frame: J2000 Target: Paaa+01Paaa+02REF | ||
| Filter | IM LBA 1 beam | Bandpass filter applied | LBA_10_90 HBA_110_190 |
| Antenna set | IM LBA 1 beam | Select the antenna mode to observe with | LBA_SPARSE_EVEN HBA_DUAL_INNER |
Time averaging steps | IM LBA 1 beam, IM LBA 1 beam and IM LBA Survey 3 beam | Factor used to average the data in time | 2 |
Freq averaging steps | IM LBA 1 beam, IM LBA 1 beam and IM LBA Survey 3 beam | Factor used to average the data in frequency | 3 |
| Demix pipeline | IM LBA 1 beam and IM LBA Survey 3 beam. | Given in several drop-down menus per target/calibrator where the user can select what sources to demix. Note that the time step and frequency step in this menu have to be multiples of the previously defined averaging steps. | Sources: CasA, CygA, HerA, HydraA, TauA, VirA Time step: 8 Ignore Target: false Frequency step: 64 |
Edit a scheduling unit
Editing a scheduling unit is done in the most straightforward manner by finding the associated scheduling set filtering in the Scheduling Units tab in TMSS or simply by searching for the SU name in the search bar of TMSS. Then selecting the correct scheduling unit by clicking the
'eye' icon on the left-hand side of the table. Once the user enters the 'Scheduling Unit - Details' menu, make sure you are in the 'Draft' tab of the 'Task Details' section. Now if the user wants to change the global description of the scheduling unit or, for example, wants to change the project or description, one can click the 2nd icon on the top right (pencil and paper icon) to change the SU's Details. From this view, the user can also change the Task Details by selecting the appropriate task that needs changes and clicking the edit button that is right from the Task Details header. Below the Task Details section one can see the familiar Observation Specifications as shown during the SU creation and these can be changed accordingly as well on a SU level.
Tasks and sub-tasks
The tasks are already defined when creating a scheduling unit, and the standard form of the tasks is already created for the given strategy chosen for the SU. Each observation strategy has a unique set of parameters that ultimately define these tasks. In the most general case, tasks are divided in different categories that are: Observation, Pipelines and Ingest. Most often the Observation tasks (depending on the strategy) consist of the Target observations (the number depending on how many beams the strategy has) and some Calibrator observation. The Pipeline tasks consist of a pre-processing pipeline associated with each calibrator, and a pre-processing pipeline for each beam in the strategy. Lastly the Ingest tasks consist of ingesting the pre-processed data products to the indicated destination (defined in the project) and a cleanup which removes the data from the disk. Each of these tasks can be viewed in their 'Task - Details' through the eye icon and their sub-parameters can be inspected and changed.
Observation Task Specification
Within an Observation Task the user can view and edit the observation specification, such as the station set-up, observation duration etc. Very similar so what was written before during the SU creation
Pipeline Task Specification
Within a Pipeline Task the user can view and edit the parameters for the pre-processing pipeline such as averaging factors, RFI flagging strategy and cluster details.
Ingest Task Specification
Within a Ingest Task the user has to make sure that the predecessor tasks are correct before the ingest and cleanup happens.
Changing dataproducts to ingest
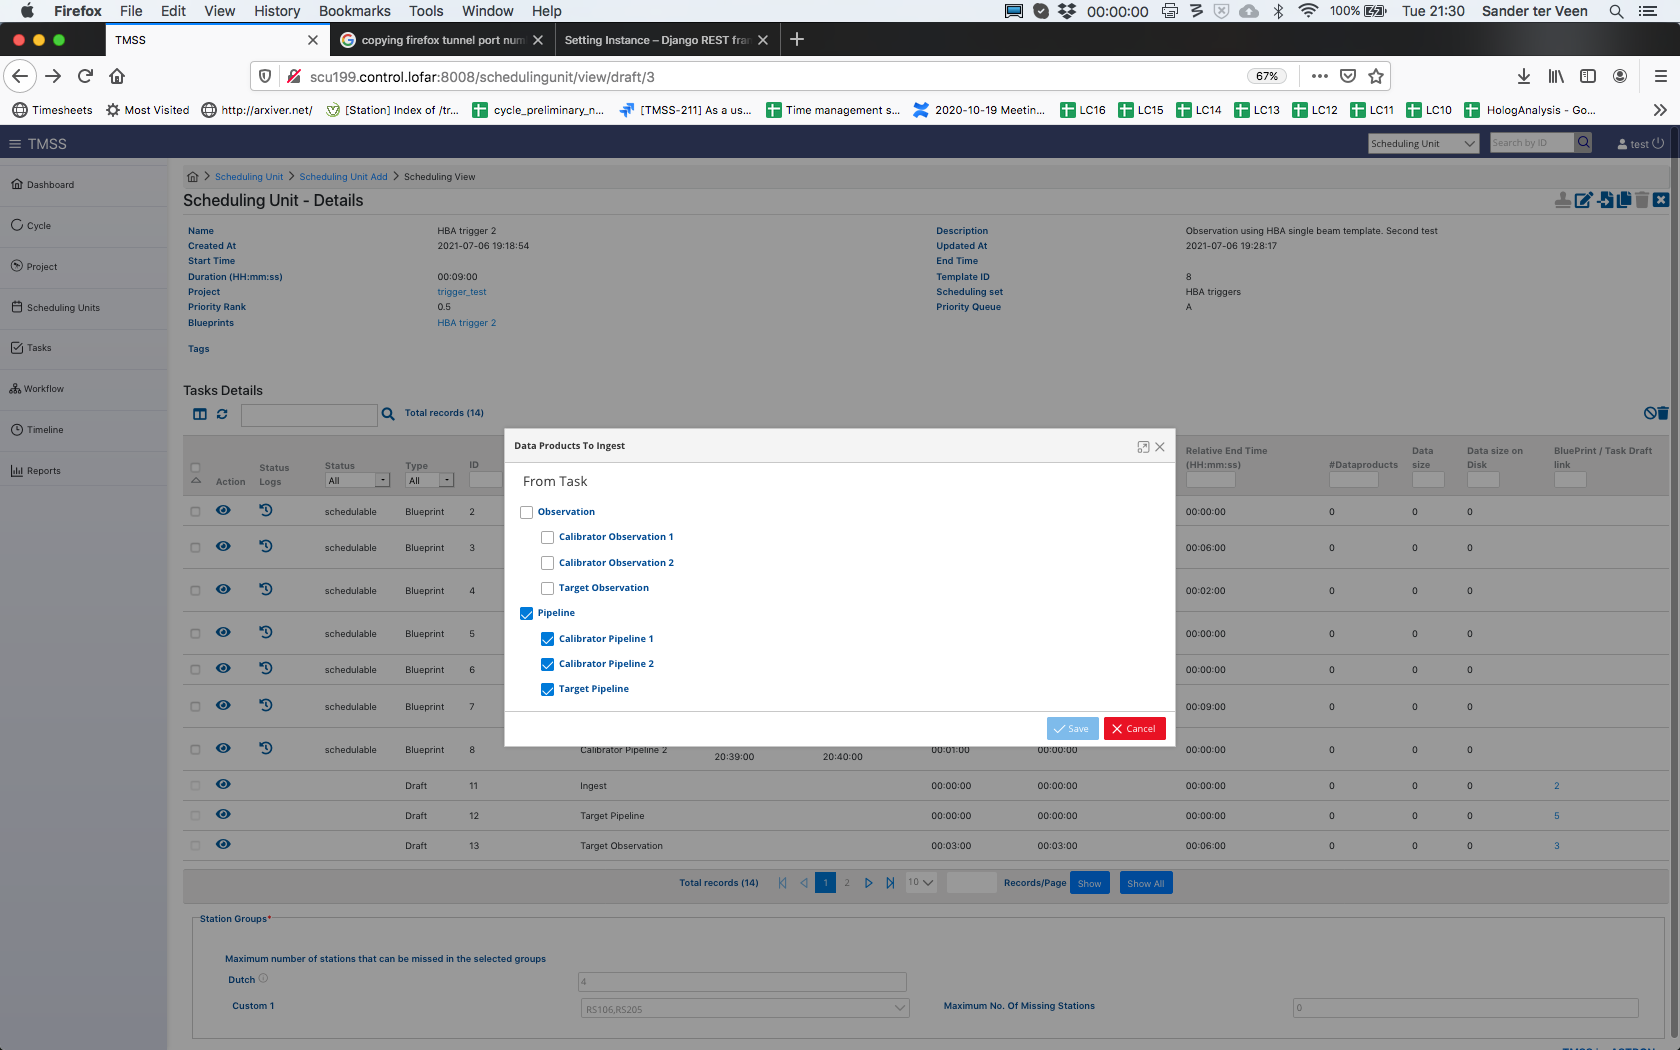
The dataproducts to ingest are part of the observing strategy. For most observing strategies, we only ingest the pipeline data. To change this, and ingest for example also the raw data, navigate to the scheduling unit page and press the ingest button ![]() . This gives a pop-up where you can select which data products to ingest.
. This gives a pop-up where you can select which data products to ingest.
This can be done both for drafts and blueprints.
Bulk Scheduling Units Specification (Scheduling Sets)
During the creation of a SU, the user can add the SU to a Scheduling Set which can be used as an easy filter in the SU menu to search for the appropriate tasks, but if for example the one pointing the SU has been created for is part of many different SUs in a project, then it has to be sorted into the correct Scheduling Set belonging to that one project. A user can also create multiple SUs at once that are then belonging to such a scheduling set by using the ![]() button. This introduces the following menu to the user:
button. This introduces the following menu to the user:
From this menu the user can specify the creation of scheduling units in a similar way as before but with the addition that they can select how many scheduling units one wants to make that belong to the same scheduling set. Once the appropriate scheduling set is chosen, this menu unfolds and turns into the view as seen below.
This way it is easiest to define all the appropriate tasks at once, plus through this view the user can easily copy paste the first SU's information into a spreadsheet and perform all needed editing of the fields and finally copy back into the TMSS table view. An example of such a spreadsheet is shown below.
Submission of Scheduling Units
The user may notice that after the creation of a SU from the previous sections the "Type" of the Tasks in the "SU - Details" view are set to Draft. The Draft status allows the user to still edit a task or scheduling unit before submission. However, in order to make a SU schedulable , it has to be properly submitted. This is done by setting the scheduling unit to Blueprint. Once a task has been set to Blueprint the tasks cannot be edited and can be scheduled immediately, so please first make sure all settings are correct. It will be scheduled at an appropriate time which should be visible in the "Week View". To create a blueprint, click on the ![]() icon:
icon:
- On the scheduling unit page
- By first selecting scheduling units on the scheduling unit list page
- By first selecting scheduling units from the list on the project page
Scheduling Units Failure and Re-submission
It is possible that an observing session results in bad data. This can be either due to not matching the requirements specified in the tasks or due to external circumstances (e.g. observing conditions poor). It means that the data can't be accepted, so the corresponding flag needs to be set. It requires the FoP to:
- Set the corresponding SU data acceptance flag to
(see procedure below). Warning: This should be done using the QA workflow interface, but a manual procedure using the TMSS API is also available.Status colour Red title false - Evaluate if repeating the failed observing session described by the failed SU is within the policy for the project (i.e. check priority and if the failed session was already a repetition)
- If possible, add more tasks to the SU; to this aim new tasks can be added in a SU by using in the "Scheduling Unit - Details" menu and then clicking on the 'paper-and-pencil' icon next to the "Task Details" section.
- If possible repeat the process of specification and submission by generating a copy of the SU draft; to this aim copy the failed blueprint of the SU to a (renamed) draft SU and blueprint it. In this case, make sure that the new SU does not retain any fixed timeslot from the failed copy. Also, make sure that any archived data related to the failed SU to be removed from the LTA via opening a ticket in the Helpdesk (project users) or directly cleaning up the archive (for SDCO operators).
- Set the corresponding SU data acceptance flag to
In order to set a SU data explicitly to
the following procedure can be used:Status colour Red title false
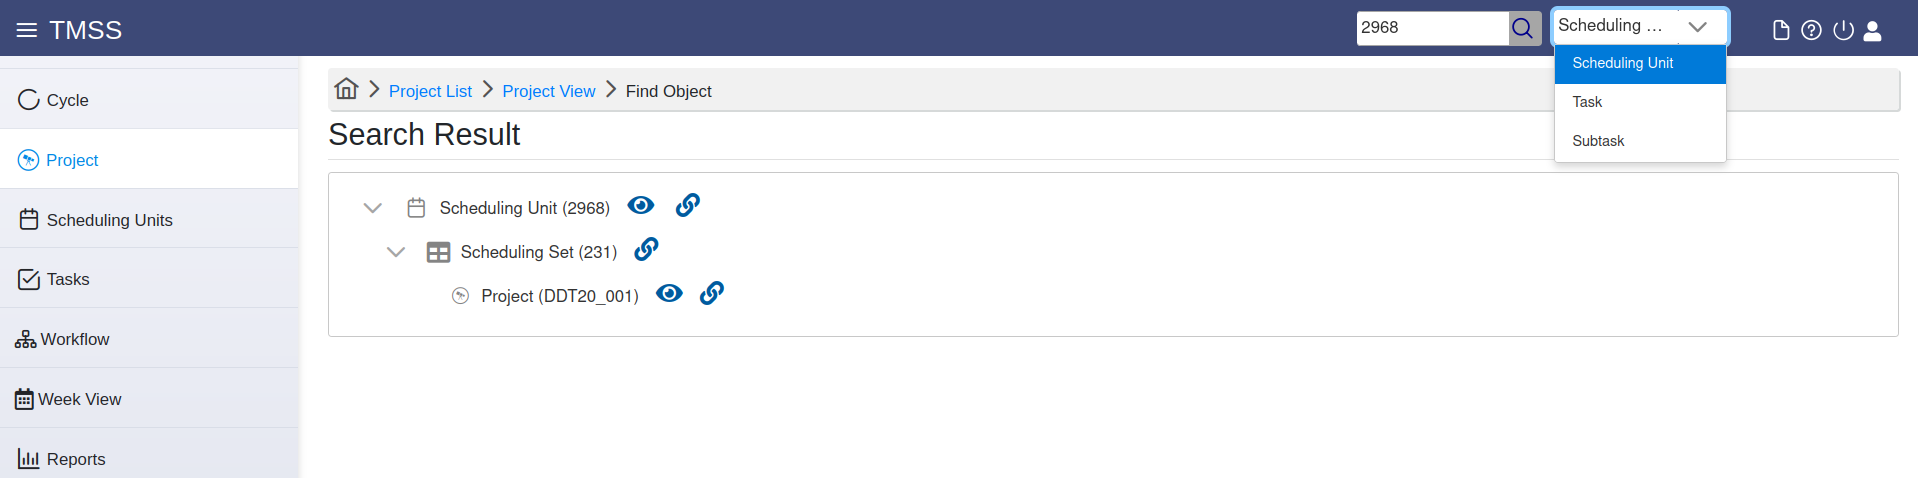
- At the top of the TMSS window, in the search input field we enter the ID of the SU blueprint, while in the drop-down menu next to it we select to search for SUs (this is the default entry, but we can also search for Tasks and Subtasks)
- We then click on the 'link' icon next to the 'Scheduling Unit' entry (the first row in the search results listing).
- The SU API view opens in another browser tab. At the bottom of the page, we click on the 'Raw data' tab in the input form section and for the 'results_accepted" key in the 'Content' text area we change its value from 'null' to 'false'.
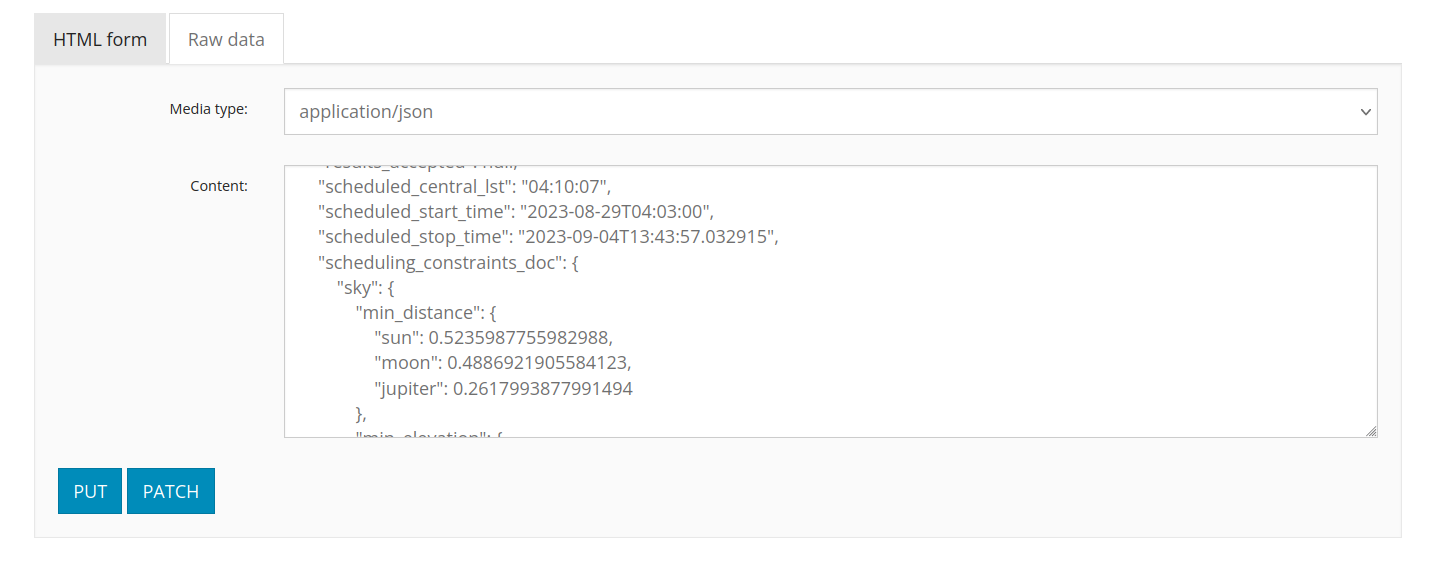
- To confirm the change, we click the 'Patch' button at the bottom of the page.
- Now, the SU data acceptance flag will be set to
, and any related (also pinned) data to the SU will be deleted, or have to be deleted manually if the prior steps were performed before the associated cleanup task has run.Status colour Red title false - If data were archived, an LTA cleanup action can be requested by project users via opening a ticket in the Helpdesk or directly performed by SDCO operators.
This concludes the Observation Specifications description. However, this is not where the responsibilities of the FoP end, as after the observation was successful the FoP has to complete the QA workflow together with the TO and the PI.
QA workflow
Accessing the workflow view
There are multiple ways to access the workflow administration space for a given SU:
- If looking for a specific workflow, it is possible to find it by:
- Using the search field in the upper bar on every TMSS page we can search for SUs using their blueprint IDs. The drop down menu next to the search box needs to be set to the (default) value of 'Scheduling Unit' (it can also be used to search for Task and Sub-task IDs).
Then, click on the 'eye' icon next to the scheduling unit, and on the SU details screen which will open, click on the 'workflow' icon (![]() ; second from the left in the row of icons on the top right of the page, across the page title).
; second from the left in the row of icons on the top right of the page, across the page title).
- Going to the scheduling units menu page, selecting Blueprint from the top drop-down menu, then enter the SU blueprint id in the corresponding column and press "Enter" to search. Then, we click on the Eye icon on the left to see the SU blueprint. Once on the details page, we click on the View Workflow icon (second from the left at the top of the page). The workflow page for this SU opens.
- If one wants to access workflows that require actions, we can use the workflow menu page accessible by clicking the corresponding menu item on the TMSS main menu on the left of the page, a listing of workflows will appear:
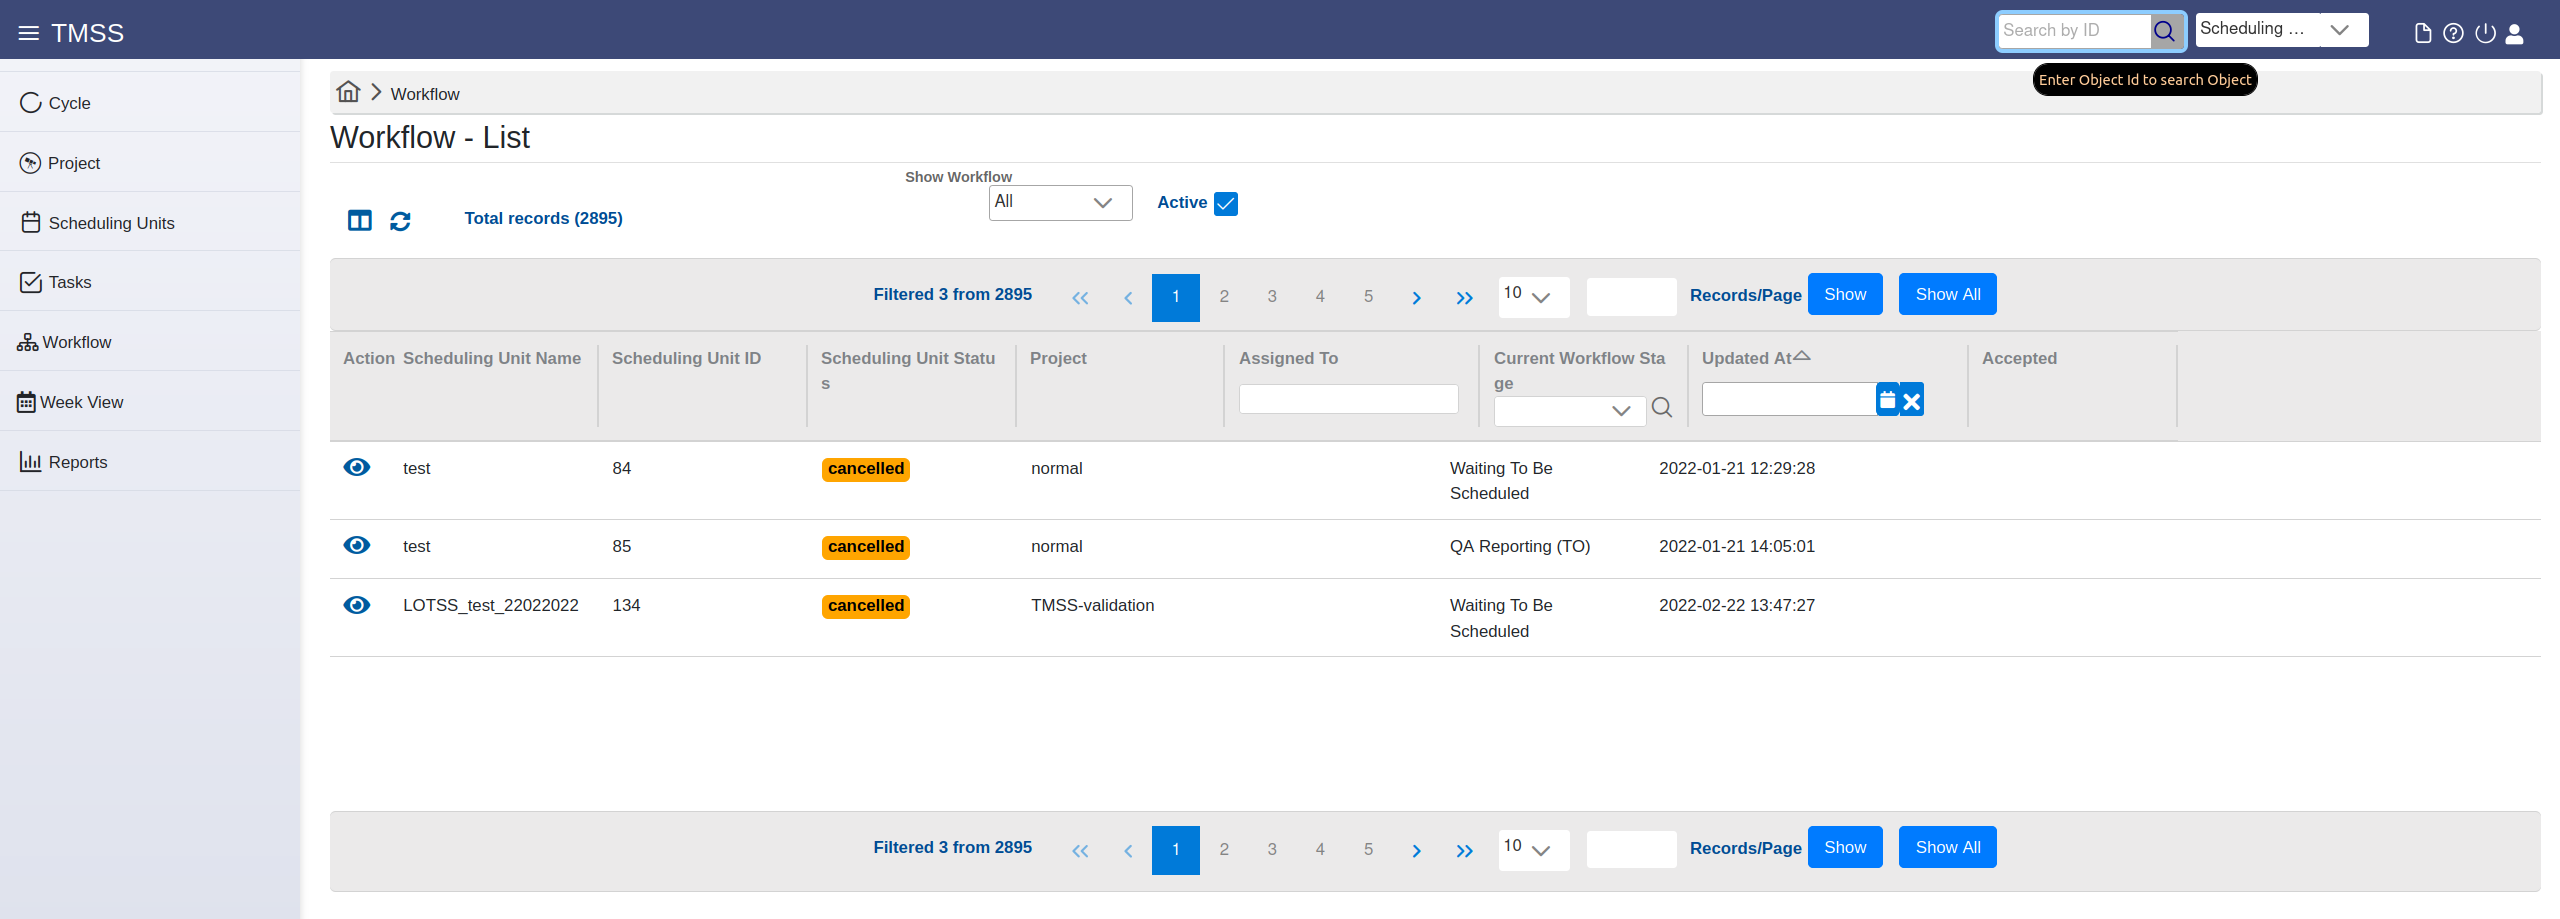
We can see the SUs which workflows are in a state we select from the drop-down above. The checkbox indicates that we filter by default on all active ones, others disappear. To find a particular SU (workflow), the user should make use of the drop-down menu options or use the column filtering options. Workflows are only associated with blueprints, so the IDs referred to here are SU blueprint , not draft IDs. Clicking on the 'eye' ison in the first column will open the workflow page for the corresponding row.
Managing the workflows
The management of the workflows is done through the dedicated workflow view page:
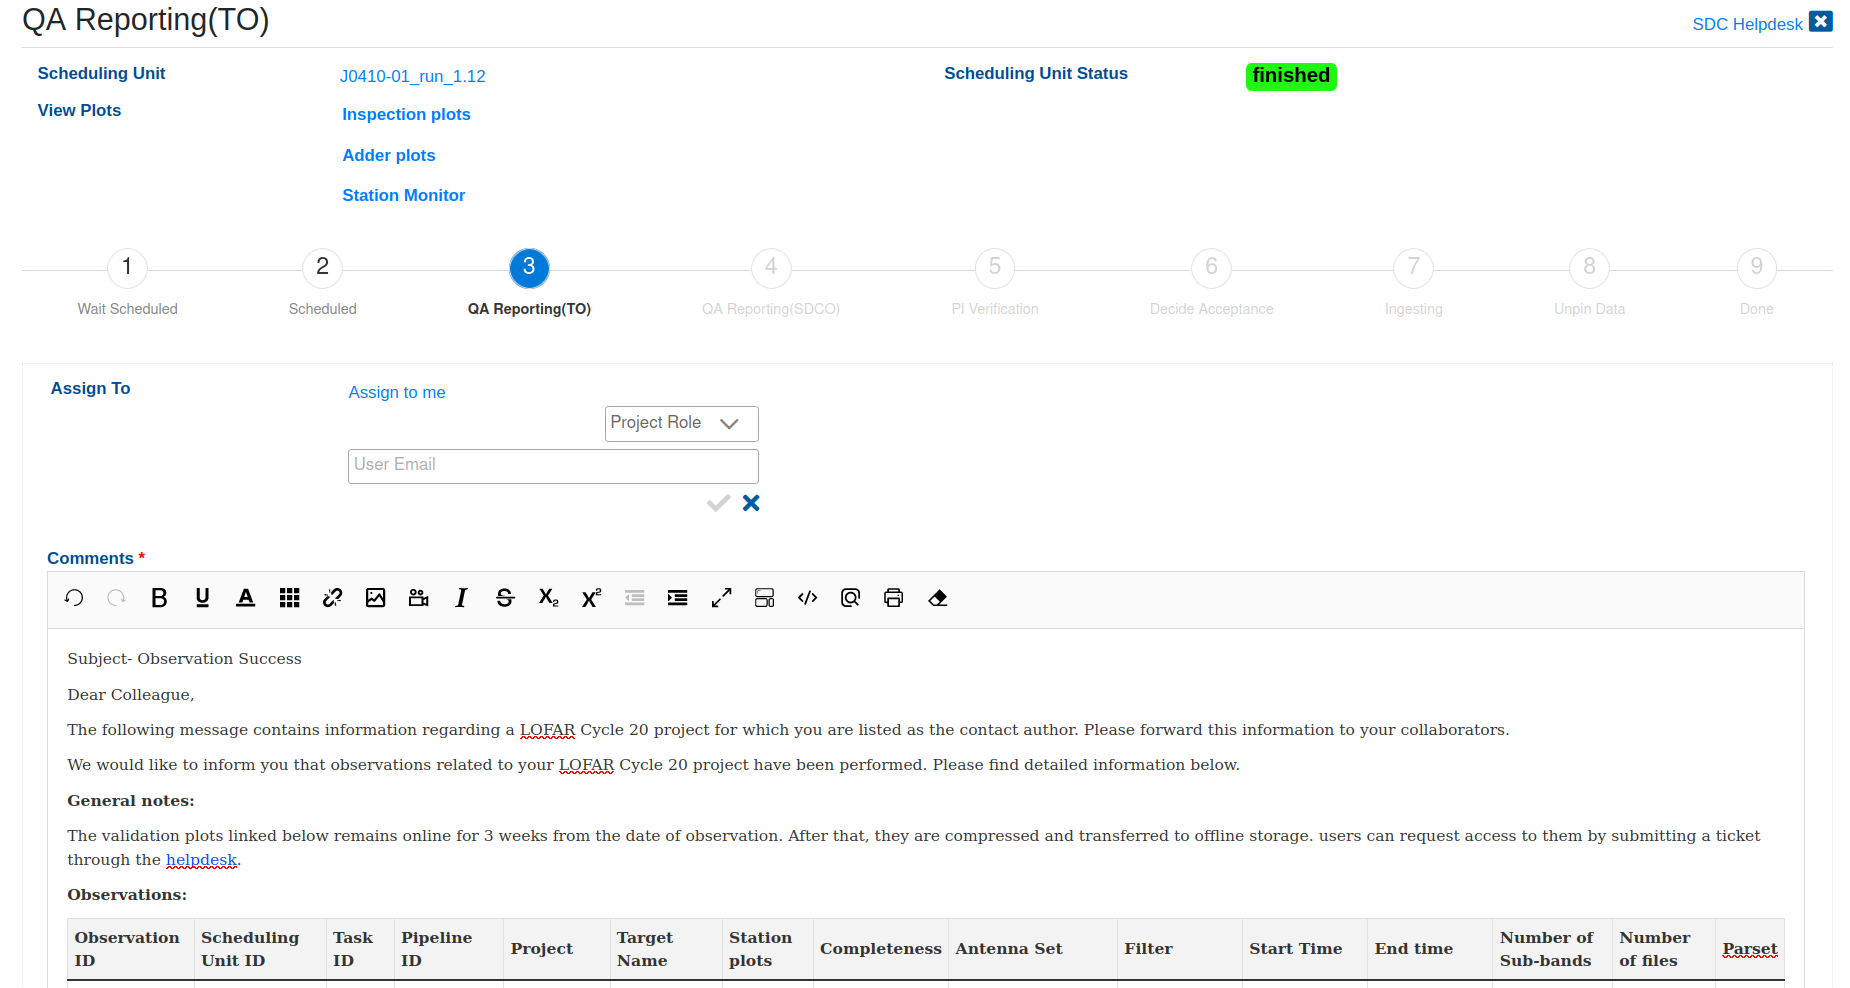
At its top there are links to the SU details page, as well as to the various inspection plots related to the observing run. These can be used by the TO/SDCO/PI as an aid when performing the quality assessment (QA). Below, a graphical representation of the workflow is given consisting of 9 steps, with the number highlighted in blue indicating the current level of progress. Their associated overviews are accessible depending on the role the user has.
If the workflow is not assigned to the current user, s/he can use the "assign to me" to perform the assignment, or choose a user to assign the QA to using an e-mail address, or assign by role, choosing from the roles provided in the "Project Role" drop-down menu.
The QA starts at level 3 where the users with telescope operator (TO) role can enter reports or comments related to the quality of the data and the performance of the system in the provided text area. It is usually pre-populated by a standard observing report.
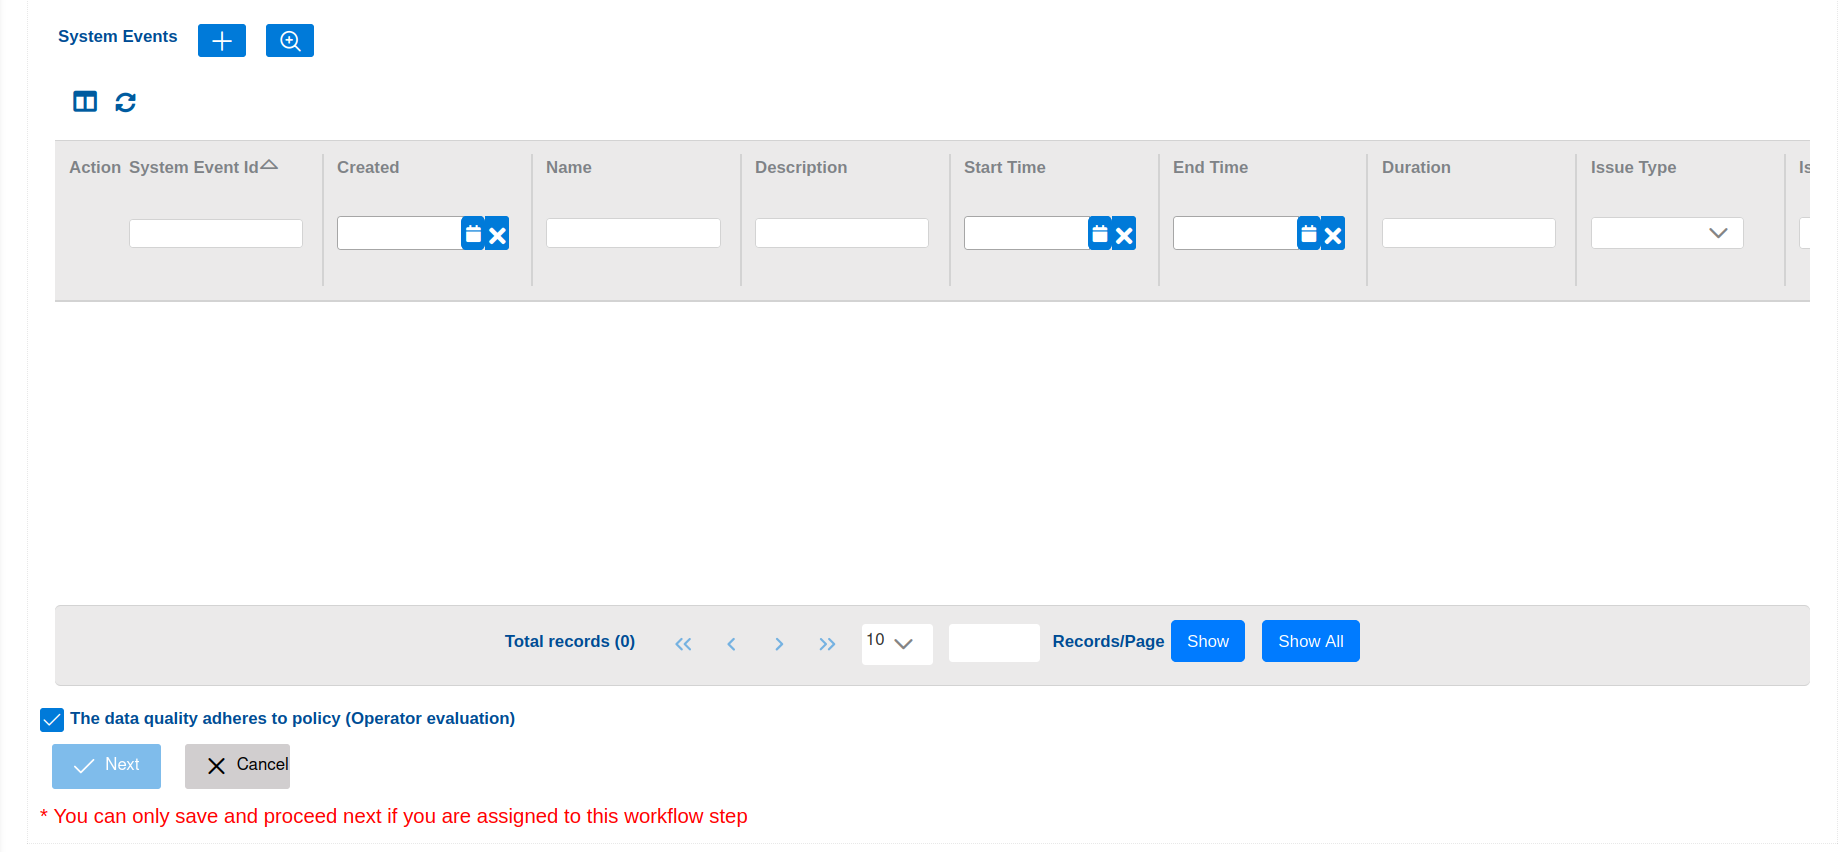
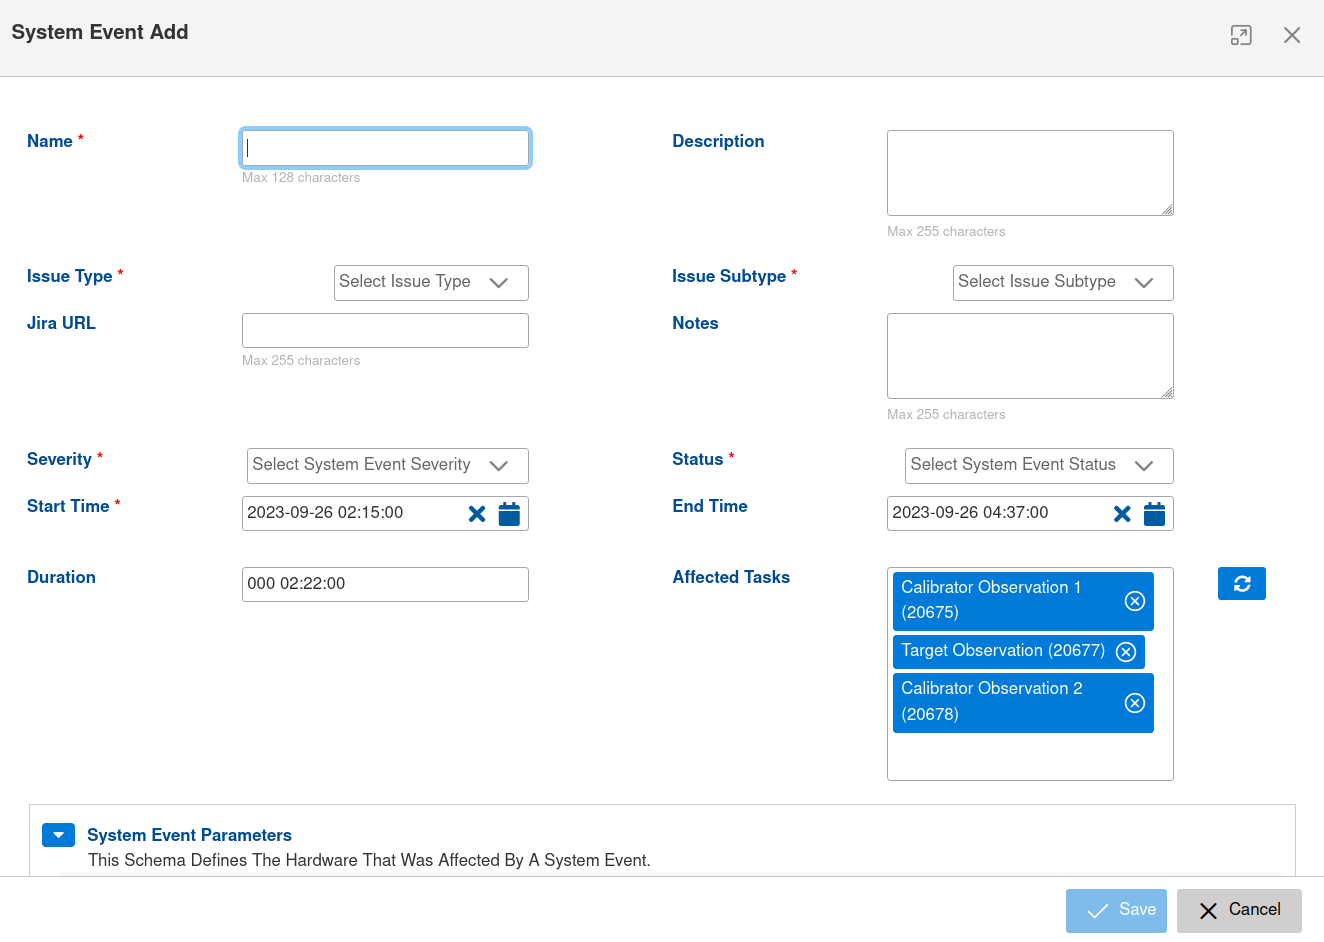
At the bottom of the page, there is a list where the TO can enter system events relevant for the QA by adding an new one (using the "+" button) or by searching for existing ones and adding them to the list (using the "Search" button next to the "+" one). The new event page opens in a pop-up where the user can enter the relevant event details:
The TO can filter the listed system events using the provided column header fields in the list.
Finally, if the TO approves that the data adheres to policy, s/he can click the "Next" button to sent the QA for the following round of assessment by the SDCO/PI.
Each of the users / roles in the workflow steps can approve or disapprove of the data quality and enter an appropriate comment. The approval state is reflected by the state of a checkbox at the bottom of the page after all of the user roles have decided on the QA state. Then, the QA assessment is finished, and the PI has an overview of the procedure. The data is unpinned / deleted or archived depending on the QA outcome. The Data Accepted columnin the blueprint listing on the TMSS project view page will indicate whether data for a given executed SU blueprint is accepted or not (false).
Please note that SDCO is still using the Jira system for handling observation reports and project users will be notified to complete the QA workflow via the corresponding ticket.
The Radio Observatory will not have the opportunity to check all data manually before it is exported to the LTA, although some automatic diagnostics are generated for system monitoring, and offline technical monitoring will be carried out regularly. The FoP or the expert user in charge of project support will send to the project PI a notification after each observation with detailed information on where to find the relevant plots. The project team is encouraged to analyze the data, at least preliminarily, soon after the observations, and to get in touch through the ASTRON helpdesk about any possible problems. Observations that turn out to have an issue that makes them unusable may be considered for only one re-run, as soon as the observing schedule allows.
Additional information about the observing and processing policies adopted by ASTRON during the LOFAR Cycles is available at the relevant pages.
Contact author instructions
As a contact author, you will be notified by e-mail or by JIRA ticket if new reports are ready for inspection. Please make sure you can receive e-mail from ASTRON domains. You can also see all assigned tasks to you by going to the workflow page and filtering on "assigned to me".
You are asked to confirm you will accept the data. Please write your confirmation or rejection in the box. In case there are issues that you want to raise for which you consider not accepting the data, then please add in the comment box and untick the "PI accepts box". For the data policy, please consult the relevant information page. Your friend-of-project will contact you in JIRA for the final decision on what to do with the data. After this period you still have 4 weeks for a detailed data inspection. In case there are issues, please report them in JIRA. Please note that in case you do not accept the data, this data cannot be used and should be removed from your systems. We will also remove them from the LTA. A repetition will be scheduled instead if your observation is eligible for one, see again the policies.